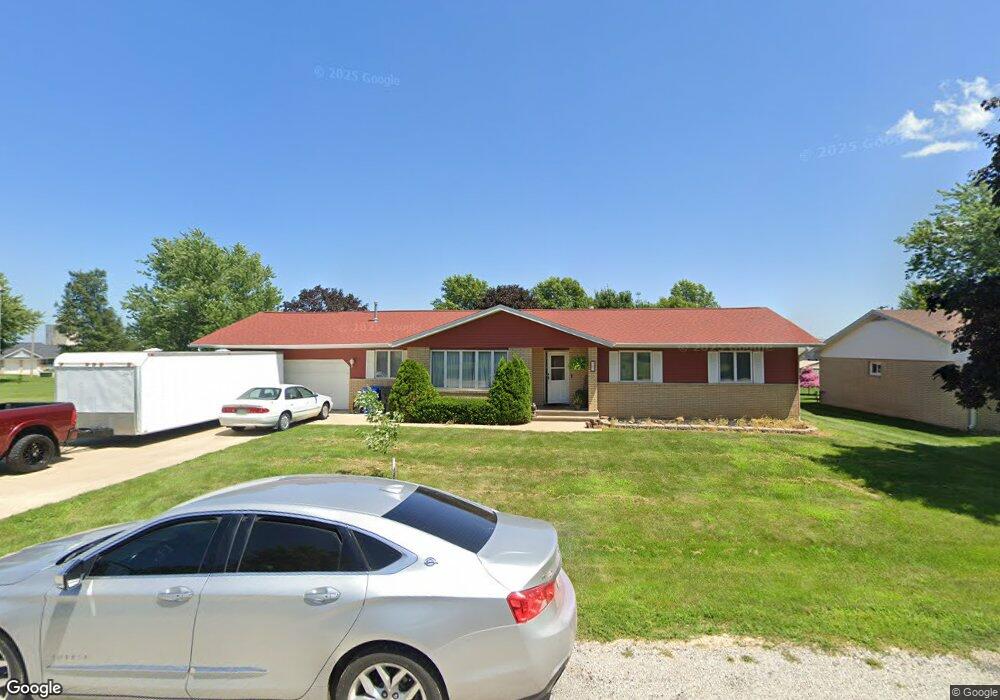
507 9th Ave Clarence, IA 52216
Estimated Value: $202,000 - $228,671
4
Beds
1
Bath
1,483
Sq Ft
$148/Sq Ft
Est. Value
About This Home
This home is located at 507 9th Ave, Clarence, IA 52216 and is currently estimated at $220,168, approximately $148 per square foot. 507 9th Ave is a home located in Cedar County with nearby schools including North Cedar Junior/Senior High School.
Ownership History
Date
Name
Owned For
Owner Type
Purchase Details
Closed on
Jan 11, 2024
Sold by
Hormann Ruth E
Bought by
Shrope Nickolas M and Shrope Danielle E
Current Estimated Value
Home Financials for this Owner
Home Financials are based on the most recent Mortgage that was taken out on this home.
Original Mortgage
$223,250
Outstanding Balance
$218,992
Interest Rate
7.03%
Mortgage Type
New Conventional
Estimated Equity
$1,176
Create a Home Valuation Report for This Property
The Home Valuation Report is an in-depth analysis detailing your home's value as well as a comparison with similar homes in the area
Home Values in the Area
Average Home Value in this Area
Purchase History
| Date | Buyer | Sale Price | Title Company |
|---|---|---|---|
| Shrope Nickolas M | $235,000 | None Listed On Document |
Source: Public Records
Mortgage History
| Date | Status | Borrower | Loan Amount |
|---|---|---|---|
| Open | Shrope Nickolas M | $223,250 |
Source: Public Records
Tax History Compared to Growth
Tax History
| Year | Tax Paid | Tax Assessment Tax Assessment Total Assessment is a certain percentage of the fair market value that is determined by local assessors to be the total taxable value of land and additions on the property. | Land | Improvement |
|---|---|---|---|---|
| 2025 | $3,018 | $228,870 | $23,980 | $204,890 |
| 2024 | $3,018 | $218,820 | $23,980 | $194,840 |
| 2023 | $2,816 | $211,870 | $23,980 | $187,890 |
| 2022 | $2,396 | $153,590 | $22,480 | $131,110 |
| 2021 | $2,452 | $153,590 | $22,480 | $131,110 |
| 2020 | $2,352 | $153,590 | $22,480 | $131,110 |
| 2019 | $2,456 | $150,600 | $0 | $0 |
| 2018 | $2,388 | $150,600 | $0 | $0 |
| 2017 | $2,388 | $146,140 | $0 | $0 |
| 2016 | $2,382 | $146,140 | $0 | $0 |
| 2015 | $2,354 | $146,140 | $0 | $0 |
| 2014 | $2,266 | $146,140 | $0 | $0 |
Source: Public Records
Map
Nearby Homes