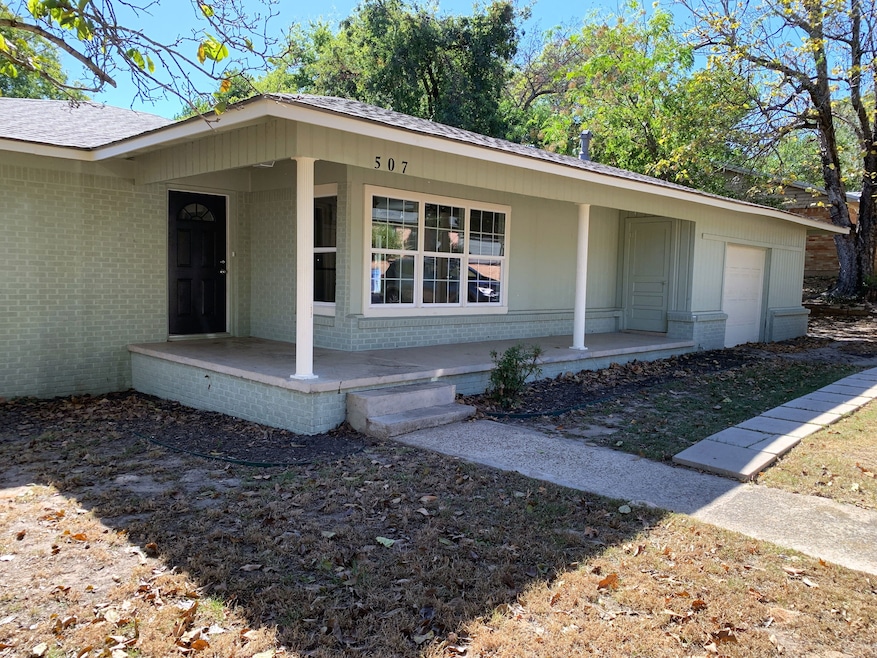
507 Davis Dr Athens, TX 75751
Estimated payment $1,493/month
About This Home
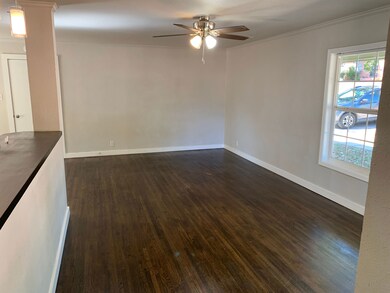
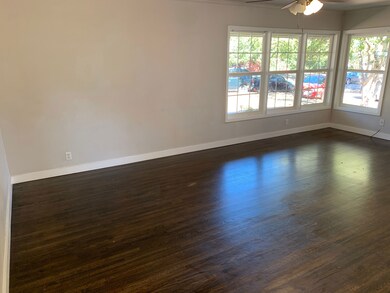
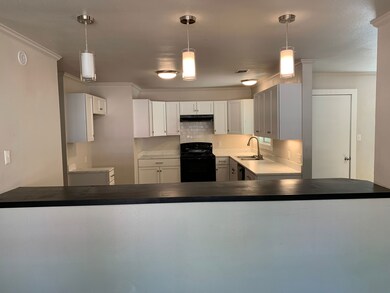
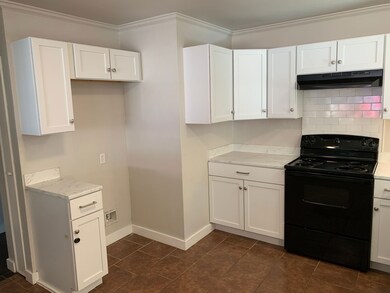
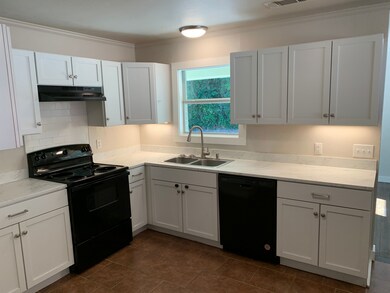
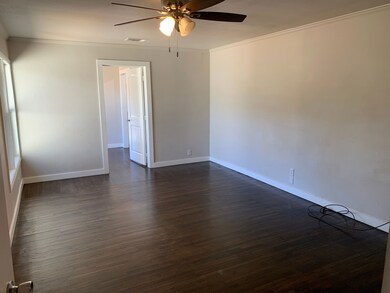
Welcome to this beautifully updated 3-bedroom, 2-bath home offering 1,728 sq. ft. of comfortable living space right in the heart of Athens. Step inside to a spacious living area with an open-concept kitchen, perfect for entertaining or relaxing with family. Large windows fill the home with natural light, highlighting the modern finishes and inviting atmosphere throughout. Each bedroom is generously sized, providing plenty of room for rest and privacy. The home sits on approximately 0.26 acres, giving you a large yard with endless possibilities for outdoor enjoyment. Conveniently located near downtown Athens, the hospital, shopping, and local schools — this home offers both comfort and convenience. With updated fixtures, bright interiors, and an ideal location, this property is ready for you to call it home. Property also available for lease. See broker for additional information.

Home Details
Home Type
- Single Family
Est. Annual Taxes
- $5,246
Bedrooms and Bathrooms
- 3 Bedrooms
- 2 Full Bathrooms
Map
Home Values in the Area
Average Home Value in this Area
Tax History
| Year | Tax Paid | Tax Assessment Tax Assessment Total Assessment is a certain percentage of the fair market value that is determined by local assessors to be the total taxable value of land and additions on the property. | Land | Improvement |
|---|---|---|---|---|
| 2025 | $5,246 | $247,851 | $3,113 | $244,738 |
| 2024 | $5,246 | $247,851 | $3,113 | $244,738 |
| 2023 | $5,025 | $232,436 | $3,113 | $229,323 |
| 2022 | $4,764 | $196,770 | $4,070 | $192,700 |
| 2021 | $3,712 | $137,060 | $4,070 | $132,990 |
| 2020 | $3,512 | $126,080 | $4,070 | $122,010 |
| 2019 | $3,187 | $111,830 | $4,070 | $107,760 |
| 2018 | $2,694 | $94,370 | $4,070 | $90,300 |
| 2017 | $2,644 | $92,600 | $4,070 | $88,530 |
| 2016 | $1,628 | $57,020 | $4,070 | $52,950 |
| 2015 | $1,451 | $57,020 | $4,070 | $52,950 |
| 2014 | $1,451 | $57,020 | $4,070 | $52,950 |
Property History
| Date | Event | Price | List to Sale | Price per Sq Ft | Prior Sale |
|---|---|---|---|---|---|
| 10/28/2025 10/28/25 | For Sale | $200,000 | 0.0% | $116 / Sq Ft | |
| 10/22/2025 10/22/25 | For Rent | $1,600 | 0.0% | -- | |
| 11/10/2016 11/10/16 | Sold | -- | -- | -- | View Prior Sale |
| 11/08/2016 11/08/16 | For Sale | $110,000 | -- | $67 / Sq Ft |
Purchase History
| Date | Type | Sale Price | Title Company |
|---|---|---|---|
| Vendors Lien | -- | Old Republic Title | |
| Deed | -- | -- | |
| Vendors Lien | -- | None Available | |
| Deed | -- | -- | |
| Special Warranty Deed | -- | None Available | |
| Deed | -- | -- | |
| Trustee Deed | $61,949 | None Available | |
| Deed | -- | -- |
Mortgage History
| Date | Status | Loan Amount | Loan Type |
|---|---|---|---|
| Open | $76,000 | Purchase Money Mortgage | |
| Previous Owner | $44,200 | Purchase Money Mortgage |
- 509 Davis Dr
- 713 Southoak Dr
- 900 Barbara St
- 309 Laird Ln
- 507 E Bryson Ave
- 507 E Bryson Ave Unit A
- 417 S Prairieville St
- 415 S Prairieville St
- 160 Gibson Rd
- 101 Larue St
- 1600 S Palestine St
- 207 W College St Unit 206
- 401 S Carroll St
- 503 A E College
- 503 B E College
- 106 Matthews St
- 904 N Hamlett St
- 300 Lila Ln
- 2050 State Highway 31
- 2969 Fm 2495