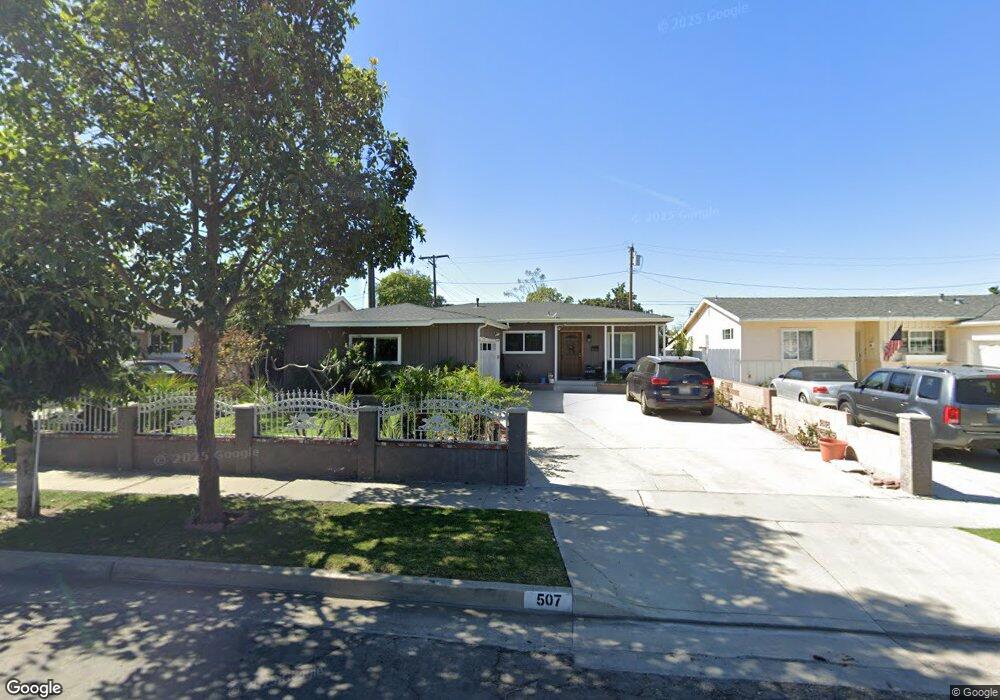
507 Eadington Ave Fullerton, CA 92833
Estimated Value: $939,000 - $1,131,000
5
Beds
3
Baths
1,826
Sq Ft
$557/Sq Ft
Est. Value
About This Home
This home is located at 507 Eadington Ave, Fullerton, CA 92833 and is currently estimated at $1,016,441, approximately $556 per square foot. 507 Eadington Ave is a home located in Orange County with nearby schools including Pacific Drive Elementary School, Nicolas Junior High School, and Sunny Hills High School.
Ownership History
Date
Name
Owned For
Owner Type
Purchase Details
Closed on
Nov 1, 2001
Sold by
Patel Jayrambhia A
Bought by
Patel Jayrambhai A and Patel Dipak A
Current Estimated Value
Home Financials for this Owner
Home Financials are based on the most recent Mortgage that was taken out on this home.
Original Mortgage
$159,000
Interest Rate
6.73%
Purchase Details
Closed on
Nov 18, 1998
Sold by
Amaro Ronald and Amaro Elaine D
Bought by
Patel Jayrambhai A
Home Financials for this Owner
Home Financials are based on the most recent Mortgage that was taken out on this home.
Original Mortgage
$157,600
Interest Rate
6.82%
Mortgage Type
Stand Alone First
Purchase Details
Closed on
May 12, 1998
Sold by
Mason Fredrick T
Bought by
Amaro Ronald and Amaro Elaine D
Home Financials for this Owner
Home Financials are based on the most recent Mortgage that was taken out on this home.
Original Mortgage
$90,000
Interest Rate
7.17%
Mortgage Type
Seller Take Back
Create a Home Valuation Report for This Property
The Home Valuation Report is an in-depth analysis detailing your home's value as well as a comparison with similar homes in the area
Purchase History
We collect this data history from publicly available records. To have your information removed, we recommend requesting removal directly through your county’s website.
| Date | Buyer | Sale Price | Title Company |
|---|---|---|---|
| Patel Jayrambhai A | -- | Gateway Title Company | |
| Patel Jayrambhai A | $197,000 | Gateway Title Company | |
| Amaro Ronald | $100,000 | -- |
Source: Public Records
Mortgage History
We collect this data history from publicly available records. To have your information removed, we recommend requesting removal directly through your county’s website.
| Date | Status | Borrower | Loan Amount |
|---|---|---|---|
| Closed | Patel Jayrambhai A | $159,000 | |
| Closed | Patel Jayrambhai A | $157,600 | |
| Previous Owner | Amaro Ronald | $90,000 |
Source: Public Records
Tax History
| Year | Tax Paid | Tax Assessment Tax Assessment Total Assessment is a certain percentage of the fair market value that is determined by local assessors to be the total taxable value of land and additions on the property. | Land | Improvement |
|---|---|---|---|---|
| 2025 | $3,514 | $305,691 | $211,626 | $94,065 |
| 2024 | $3,514 | $299,698 | $207,477 | $92,221 |
| 2023 | $3,426 | $293,822 | $203,409 | $90,413 |
| 2022 | $3,398 | $288,061 | $199,420 | $88,641 |
| 2021 | $3,339 | $282,413 | $195,510 | $86,903 |
| 2020 | $3,319 | $279,518 | $193,506 | $86,012 |
| 2019 | $3,236 | $274,038 | $189,712 | $84,326 |
| 2018 | $3,186 | $268,665 | $185,992 | $82,673 |
| 2017 | $3,133 | $263,398 | $182,346 | $81,052 |
| 2016 | $3,068 | $258,234 | $178,771 | $79,463 |
| 2015 | $2,983 | $254,356 | $176,086 | $78,270 |
| 2014 | $2,897 | $249,374 | $172,637 | $76,737 |
Source: Public Records
Map
Nearby Homes
- 1448 W W
- 401 S Basque Ave
- 1006 S Lambert Dr
- 618 S Lee Ave
- 1600 W Orangethorpe Ave
- 1913 W Valencia Dr
- 228 Adlena Dr
- 224 Winetta Place
- 1201 W Valencia Dr Unit 77
- 1201 W Valencia Dr Unit 120
- 1201 W Valencia Dr Unit 18
- 1312 W Orangethorpe Ave
- 313 Napa Ct
- 2101 W Ash Ave
- 1850 W Orangethorpe Ave Unit 44
- 1850 W Orangethorpe Ave Unit 25
- 300 N Wayne Ave
- 1412 W Baker Ave
- 400 Diana Place
- 1519 W Maxzim Ave
- 501 Eadington Ave
- 419 Eadington Ave
- 413 Eadington Ave
- 513 Eadington Ave
- 500 S Pacific Dr
- 412 S Pacific Dr
- 504 S Pacific Dr
- 1530 W Ash Ave
- 407 Eadington Ave
- 519 Eadington Ave
- 408 S Pacific Dr
- 510 S Pacific Dr
- 1531 W Ash Ave
- 1531 W Oak Ave
- 1524 W Ash Ave
- 404 S Pacific Dr
- 1599 W Oak Ave
- 401 Eadington Ave
- 1525 W Ash Ave
- 1525 W Oak Ave
Your Personal Tour Guide
Ask me questions while you tour the home.