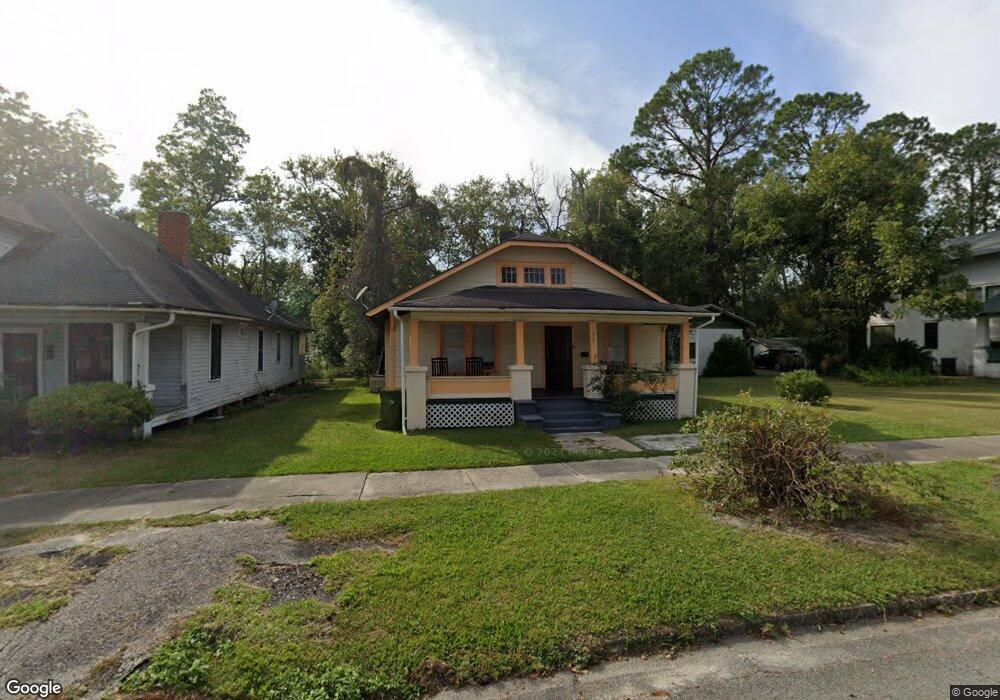
507 N Nicholls St Waycross, GA 31503
Estimated Value: $63,445 - $103,000
--
Bed
1
Bath
1,314
Sq Ft
$66/Sq Ft
Est. Value
About This Home
This home is located at 507 N Nicholls St, Waycross, GA 31503 and is currently estimated at $86,361, approximately $65 per square foot. 507 N Nicholls St is a home located in Ware County with nearby schools including Waresboro Elementary School, Ware County Middle School, and Ware County High School.
Ownership History
Date
Name
Owned For
Owner Type
Purchase Details
Closed on
Jan 5, 2021
Sold by
Max Service & Properties Inc
Bought by
Jagoo Surujnarine
Current Estimated Value
Home Financials for this Owner
Home Financials are based on the most recent Mortgage that was taken out on this home.
Original Mortgage
$18,000
Interest Rate
2.7%
Mortgage Type
New Conventional
Purchase Details
Closed on
May 2, 2010
Sold by
Westrick Charles O and Westrick Lucinda L
Bought by
Carter Margo
Purchase Details
Closed on
May 1, 2010
Sold by
Westrick Charles O and Westrick Lucinda L
Bought by
Carter Margo
Purchase Details
Closed on
Aug 24, 2007
Sold by
Mcdaniel A A
Bought by
Westrick Charles O and Westrick Lucinda L
Home Financials for this Owner
Home Financials are based on the most recent Mortgage that was taken out on this home.
Original Mortgage
$28,500
Interest Rate
6.65%
Mortgage Type
New Conventional
Purchase Details
Closed on
Jan 20, 2005
Sold by
Mcdaniel A A
Bought by
Mcdaniel A A
Create a Home Valuation Report for This Property
The Home Valuation Report is an in-depth analysis detailing your home's value as well as a comparison with similar homes in the area
Home Values in the Area
Average Home Value in this Area
Purchase History
| Date | Buyer | Sale Price | Title Company |
|---|---|---|---|
| Jagoo Surujnarine | $18,000 | -- | |
| Carter Margo | $50,330 | -- | |
| Carter Margo | $50,300 | -- | |
| Westrick Charles O | $30,000 | -- | |
| Mcdaniel A A | -- | -- |
Source: Public Records
Mortgage History
| Date | Status | Borrower | Loan Amount |
|---|---|---|---|
| Closed | Jagoo Surujnarine | $18,000 | |
| Previous Owner | Westrick Charles O | $28,500 |
Source: Public Records
Tax History Compared to Growth
Tax History
| Year | Tax Paid | Tax Assessment Tax Assessment Total Assessment is a certain percentage of the fair market value that is determined by local assessors to be the total taxable value of land and additions on the property. | Land | Improvement |
|---|---|---|---|---|
| 2024 | $775 | $20,075 | $814 | $19,261 |
| 2023 | $692 | $19,327 | $575 | $18,752 |
| 2022 | $593 | $19,327 | $575 | $18,752 |
| 2021 | $621 | $14,356 | $575 | $13,781 |
| 2020 | $617 | $14,147 | $575 | $13,572 |
| 2019 | $395 | $8,927 | $575 | $8,352 |
| 2018 | $375 | $8,405 | $575 | $7,830 |
| 2017 | $366 | $8,405 | $575 | $7,830 |
| 2016 | $366 | $8,405 | $575 | $7,830 |
| 2015 | $369 | $8,405 | $575 | $7,830 |
| 2014 | $369 | $8,405 | $575 | $7,830 |
| 2013 | -- | $8,513 | $575 | $7,938 |
Source: Public Records
Map
Nearby Homes
- 505 N Nicholls St
- 503 N Nicholls St
- 1003 Carswell Ave
- 601 N Nicholls St
- 506 McDonald St
- 605 Walker St
- 1006 Roosevelt St
- 516 Folks St
- 803 Elizabeth St
- 629 Remshart St
- 00 Roosevelt St
- 1401 Carswell Ave
- 1208 Margaret St
- 1103 Ann St
- 00 Myers Ave
- 1125 Georgia St
- 1322 Jane St
- 0 Camp Branch Cross Rd Unit 12958956
- 0 Camp Branch Cross Rd Unit 147575
- 0 Camp Branch Cross Rd Unit 10127958
- 509 N Nicholls St
- 503 1/2 N Nicholls St
- 510 Izlar St
- 514 Izlar St
- 506 Izlar St
- 506 N Nicholls St
- 511 N Nicholls St
- 501 N Nicholls St
- 1004 Isabella St
- 1006 Isabella St
- 316 N Nicholls St
- 513 N Nicholls St
- 915 Carswell Ave
- 511 Izlar St
- 505 Izlar St
- 509 Ware St
- 511 Ware St
- 513 Izlar St
- 505 Ware St
- 515 Ware St