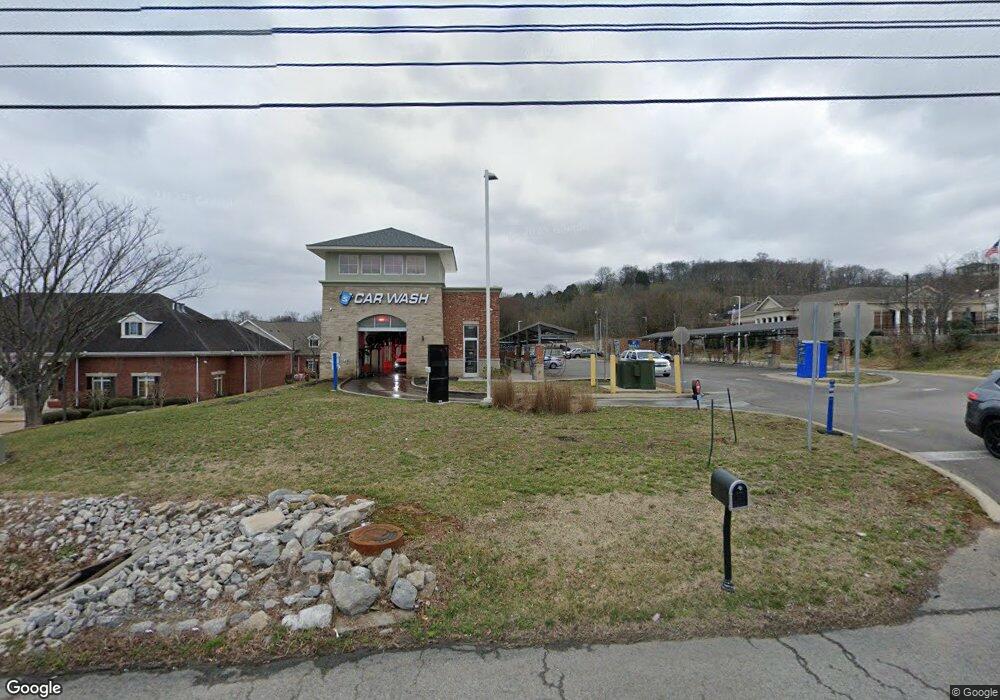
507 S James Campbell Blvd Columbia, TN 38401
Estimated Value: $7,052,515
--
Bed
1
Bath
1,892
Sq Ft
$3,728/Sq Ft
Est. Value
About This Home
This home is located at 507 S James Campbell Blvd, Columbia, TN 38401 and is currently estimated at $7,052,515, approximately $3,727 per square foot. 507 S James Campbell Blvd is a home located in Maury County with nearby schools including J. Brown Elementary School, Whitthorne Middle School, and Columbia Central High School.
Ownership History
Date
Name
Owned For
Owner Type
Purchase Details
Closed on
Apr 10, 2025
Sold by
Boing Us Holdco Inc and Boing Us Holdco Llc
Bought by
Eprt Tennessee Properties Llc
Current Estimated Value
Purchase Details
Closed on
Mar 6, 2023
Sold by
Pure Clean Express Inc
Bought by
Boing Us Holdco Inc
Purchase Details
Closed on
Oct 17, 2019
Sold by
Fc Columbia Partners Llc
Bought by
Pure Clean Express Inc
Purchase Details
Closed on
Jun 5, 2017
Sold by
Joshi Ajoya and Joshi Jysohna
Bought by
Fc Columbia Partners Llc
Purchase Details
Closed on
Oct 22, 2002
Sold by
Sethi S L and Sethi Raksha
Bought by
Joshi Ajoya and Joshi Jyosha
Purchase Details
Closed on
Sep 18, 1975
Bought by
Sethi Sethi S and Sethi Raksha
Create a Home Valuation Report for This Property
The Home Valuation Report is an in-depth analysis detailing your home's value as well as a comparison with similar homes in the area
Home Values in the Area
Average Home Value in this Area
Purchase History
| Date | Buyer | Sale Price | Title Company |
|---|---|---|---|
| Eprt Tennessee Properties Llc | $5,678,862 | First American Title | |
| Eprt Tennessee Properties Llc | $5,678,862 | First American Title | |
| Boing Us Holdco Inc | -- | -- | |
| Boing Us Holdco Inc | $6,500,000 | -- | |
| Pure Clean Express Inc | $1,350,000 | Old Republic Title Co Of Tn | |
| Fc Columbia Partners Llc | $650,000 | None Available | |
| Joshi Ajoya | $240,000 | -- | |
| Sethi Sethi S | -- | -- |
Source: Public Records
Tax History Compared to Growth
Tax History
| Year | Tax Paid | Tax Assessment Tax Assessment Total Assessment is a certain percentage of the fair market value that is determined by local assessors to be the total taxable value of land and additions on the property. | Land | Improvement |
|---|---|---|---|---|
| 2024 | $16,021 | $838,800 | $446,800 | $392,000 |
| 2023 | $16,021 | $838,800 | $446,800 | $392,000 |
| 2022 | $22,942 | $838,800 | $446,800 | $392,000 |
| 2021 | $22,942 | $717,400 | $343,680 | $373,720 |
| 2020 | $18,016 | $717,400 | $343,680 | $373,720 |
| 2019 | $5,038 | $344,920 | $343,680 | $1,240 |
| 2018 | $4,858 | $217,240 | $216,000 | $1,240 |
| 2017 | $4,956 | $127,880 | $103,120 | $24,760 |
| 2016 | $5,441 | $127,880 | $103,120 | $24,760 |
| 2015 | $5,192 | $127,880 | $103,120 | $24,760 |
| 2014 | $5,192 | $127,880 | $103,120 | $24,760 |
Source: Public Records
Map
Nearby Homes
- 2023 Denise Dr
- 1815 Ableson Way
- 1930 Woodmont Dr
- 0 Mcintosh Dr
- 2204 Denham Ave
- 308 Due Ln
- 1913 Morris Ave
- 1912 Paul Dr
- 1918 Overton Dr
- 1923 Overton Dr
- 2135 Thomas Ave
- 2124 Circle Dr
- 516 Pickens Ln
- 1818 Morningside Ave
- 112 Mckinley Dr
- 3021 Glenstone Dr
- 1830 Dimple Ct
- 501 Green Acres Dr
- 2011 Denham Ave
- 807 Brown St
- 501 S James M Campbell Blvd
- 2502 Keith Dr
- 0 Keith Dr
- 2503 Keith Dr
- 2513 Keith Dr
- 406 S James M Campbell Blvd
- 2438 Keith Dr
- 405 S James M Campbell Blvd
- 2525 Keith Dr
- 2433 Keith Dr
- 5 Pillow Dr
- 2414 Keith Dr
- 401 S James Campbell Blvd
- 208 Ashwood Dr
- 206 Ashwood Dr
- 210 Ashwood Dr
- 212 Ashwood Dr
- 204 Ashwood Dr
- 214 Ashwood Dr
- 202 Ashwood Dr