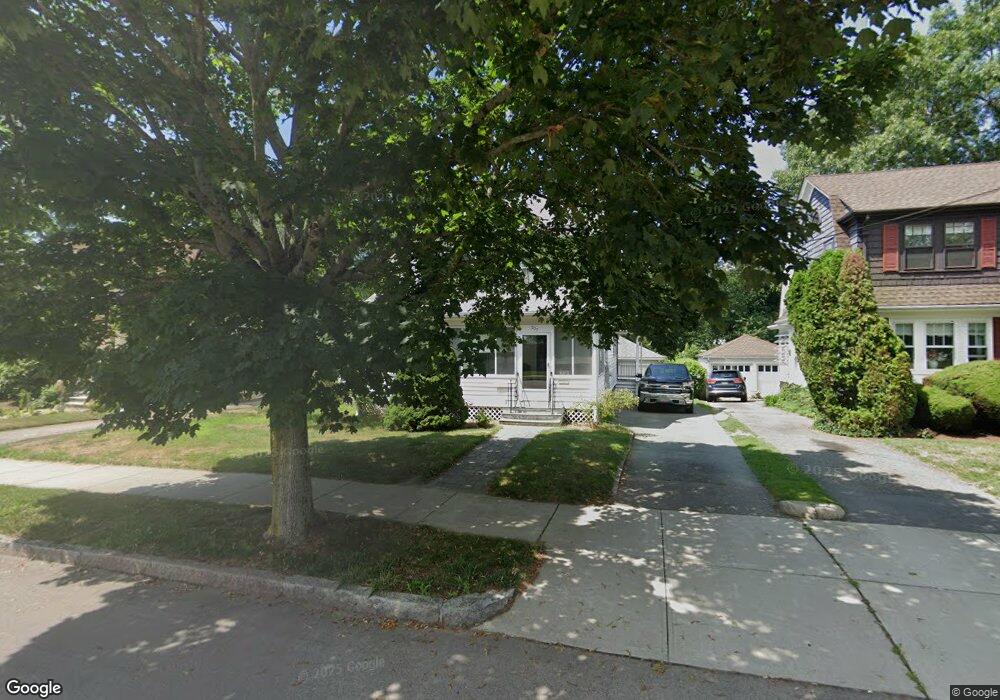
507 W Elm St Brockton, MA 02301
Estimated Value: $623,914 - $675,000
3
Beds
3
Baths
2,380
Sq Ft
$272/Sq Ft
Est. Value
About This Home
This home is located at 507 W Elm St, Brockton, MA 02301 and is currently estimated at $648,229, approximately $272 per square foot. 507 W Elm St is a home located in Plymouth County with nearby schools including Manthala George Jr. School, Hancock Elementary School, and Louis F Angelo Elementary School.
Ownership History
Date
Name
Owned For
Owner Type
Purchase Details
Closed on
Aug 17, 2020
Sold by
Mckinnon Kay M and Mckinnon Shirley A
Bought by
507 West Elm Street Irt
Current Estimated Value
Purchase Details
Closed on
Nov 15, 2002
Sold by
Pierce-Furtado M Linda
Bought by
Mckinnon K Marvin and Mckinnon Shirley A
Create a Home Valuation Report for This Property
The Home Valuation Report is an in-depth analysis detailing your home's value as well as a comparison with similar homes in the area
Home Values in the Area
Average Home Value in this Area
Purchase History
| Date | Buyer | Sale Price | Title Company |
|---|---|---|---|
| 507 West Elm Street Irt | -- | None Available | |
| Mckinnon K Marvin | $301,000 | -- |
Source: Public Records
Mortgage History
| Date | Status | Borrower | Loan Amount |
|---|---|---|---|
| Previous Owner | Mckinnon K Marvin | $20,000 | |
| Previous Owner | Mckinnon K Marvin | $198,000 |
Source: Public Records
Tax History Compared to Growth
Tax History
| Year | Tax Paid | Tax Assessment Tax Assessment Total Assessment is a certain percentage of the fair market value that is determined by local assessors to be the total taxable value of land and additions on the property. | Land | Improvement |
|---|---|---|---|---|
| 2025 | $6,283 | $518,800 | $144,900 | $373,900 |
| 2024 | $5,874 | $488,700 | $144,900 | $343,800 |
| 2023 | $5,735 | $441,800 | $109,900 | $331,900 |
| 2022 | $5,397 | $386,300 | $99,900 | $286,400 |
| 2021 | $5,065 | $349,300 | $94,600 | $254,700 |
| 2020 | $5,265 | $347,500 | $90,600 | $256,900 |
| 2019 | $5,038 | $324,200 | $85,000 | $239,200 |
| 2018 | $4,119 | $293,500 | $85,000 | $208,500 |
| 2017 | $4,294 | $266,700 | $85,000 | $181,700 |
| 2016 | $4,772 | $274,900 | $81,000 | $193,900 |
| 2015 | $4,576 | $252,100 | $81,000 | $171,100 |
| 2014 | $4,484 | $247,300 | $81,000 | $166,300 |
Source: Public Records
Map
Nearby Homes