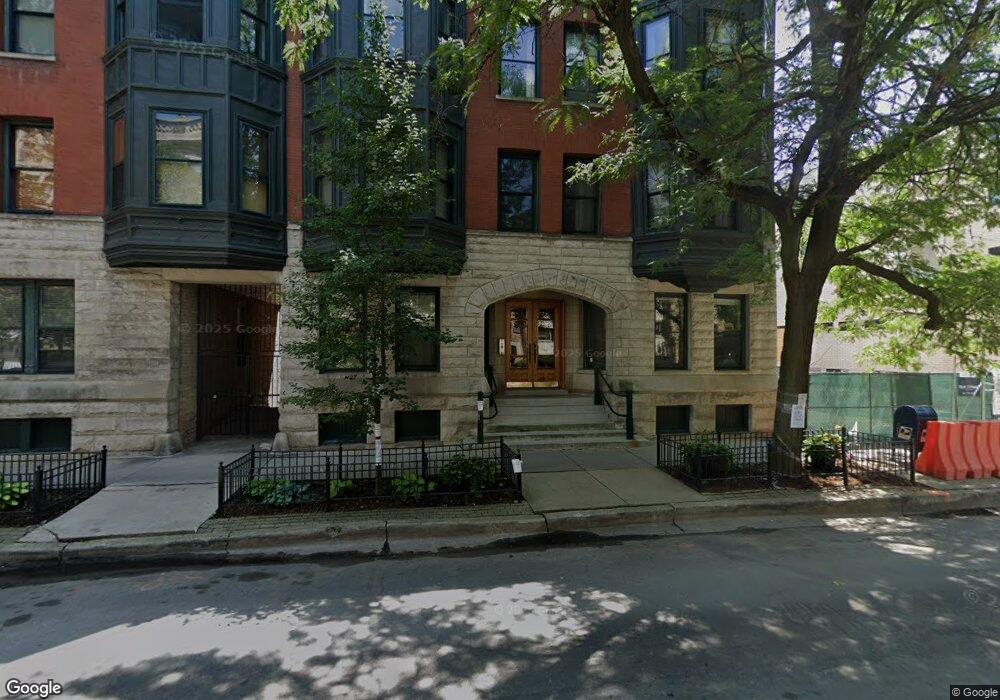
507 W Fullerton Pkwy Unit 5072 Chicago, IL 60614
Lincoln Park NeighborhoodEstimated Value: $490,000 - $548,000
2
Beds
--
Bath
1,300
Sq Ft
$400/Sq Ft
Est. Value
About This Home
This home is located at 507 W Fullerton Pkwy Unit 5072, Chicago, IL 60614 and is currently estimated at $520,623, approximately $400 per square foot. 507 W Fullerton Pkwy Unit 5072 is a home located in Cook County with nearby schools including Abraham Lincoln Elementary School, Lincoln Park High School, and Guidepost Montessori at Lincoln Park.
Ownership History
Date
Name
Owned For
Owner Type
Purchase Details
Closed on
Feb 24, 2005
Sold by
Turchan Cathy and Colbert Cathy
Bought by
Miranzadeh Florian
Current Estimated Value
Home Financials for this Owner
Home Financials are based on the most recent Mortgage that was taken out on this home.
Original Mortgage
$278,800
Outstanding Balance
$136,733
Interest Rate
5.12%
Mortgage Type
Unknown
Estimated Equity
$383,890
Purchase Details
Closed on
Sep 11, 2000
Sold by
Gilbert Patricia G
Bought by
Colbert Cathy
Purchase Details
Closed on
Dec 18, 1995
Sold by
Beechen Paul R and Beechen Marybeth P
Bought by
Gilbert Patricia G
Home Financials for this Owner
Home Financials are based on the most recent Mortgage that was taken out on this home.
Original Mortgage
$103,000
Interest Rate
7.42%
Create a Home Valuation Report for This Property
The Home Valuation Report is an in-depth analysis detailing your home's value as well as a comparison with similar homes in the area
Home Values in the Area
Average Home Value in this Area
Purchase History
| Date | Buyer | Sale Price | Title Company |
|---|---|---|---|
| Miranzadeh Florian | $348,500 | First American Title | |
| Colbert Cathy | $279,000 | Chicago Title Insurance Co | |
| Gilbert Patricia G | $135,000 | -- |
Source: Public Records
Mortgage History
| Date | Status | Borrower | Loan Amount |
|---|---|---|---|
| Open | Miranzadeh Florian | $278,800 | |
| Previous Owner | Gilbert Patricia G | $103,000 | |
| Closed | Miranzadeh Florian | $52,250 |
Source: Public Records
Tax History Compared to Growth
Tax History
| Year | Tax Paid | Tax Assessment Tax Assessment Total Assessment is a certain percentage of the fair market value that is determined by local assessors to be the total taxable value of land and additions on the property. | Land | Improvement |
|---|---|---|---|---|
| 2024 | $8,439 | $40,600 | $7,115 | $33,485 |
| 2023 | $8,227 | $40,001 | $5,738 | $34,263 |
| 2022 | $8,227 | $40,001 | $5,738 | $34,263 |
| 2021 | $8,043 | $39,999 | $5,737 | $34,262 |
| 2020 | $7,107 | $31,902 | $5,049 | $26,853 |
| 2019 | $6,961 | $34,648 | $5,049 | $29,599 |
| 2018 | $6,844 | $34,648 | $5,049 | $29,599 |
| 2017 | $6,546 | $30,410 | $4,131 | $26,279 |
| 2016 | $6,091 | $30,410 | $4,131 | $26,279 |
| 2015 | $5,573 | $30,410 | $4,131 | $26,279 |
| 2014 | $5,234 | $28,210 | $3,098 | $25,112 |
| 2013 | $5,453 | $29,980 | $3,098 | $26,882 |
Source: Public Records
Map
Nearby Homes
- 2342 N Cleveland Ave
- 444 W Fullerton Pkwy Unit 601
- 2400 N Lakeview Ave Unit 1708
- 2400 N Lakeview Ave Unit 2803
- 2400 N Lakeview Ave Unit 2804
- 2312 N Geneva Terrace
- 2440 N Lakeview Ave Unit 11D
- 2440 N Lakeview Ave Unit 11C
- 2249 N Geneva Terrace
- 345 W Fullerton Pkwy Unit 603
- 345 W Fullerton Pkwy Unit 1801
- 345 W Fullerton Pkwy Unit 2101
- 345 W Fullerton Pkwy Unit 2605
- 345 W Fullerton Pkwy Unit 1706
- 345 W Fullerton Pkwy Unit 1001
- 399 W Fullerton Pkwy Unit 16E
- 2336 N Commonwealth Ave Unit 107
- 416 W Grant Place Unit I
- 545 W Grant Place
- 626 W Belden Ave Unit 3
- 2354 N Cleveland Ave Unit 2354
- 2354 N Cleveland Ave Unit 2354
- 2354 N Cleveland Ave Unit 2354
- 2350 N Cleveland Ave Unit 2350
- 507 W Fullerton Pkwy Unit 5074
- 503 W Fullerton Pkwy Unit 5031
- 505 W Fullerton Pkwy Unit 5052
- 503 W Fullerton Pkwy Unit 5034
- 2358 N Cleveland Ave Unit 2352-3
- 2358 N Cleveland Ave Unit 2350-2
- 507 W Fullerton Pkwy Unit 5071
- 505 W Fullerton Pkwy Unit 5051
- 2354 N Cleveland Ave Unit 2354
- 2350 N Cleveland Ave Unit 2350
- 503 W Fullerton Pkwy Unit 5033
- 503 W Fullerton Pkwy Unit 5032
- 505 W Fullerton Pkwy Unit 5052
- 2350 N Cleveland Ave Unit 2350
- 507 W Fullerton Pkwy Unit 5073
- 505 W Fullerton Pkwy Unit 5054