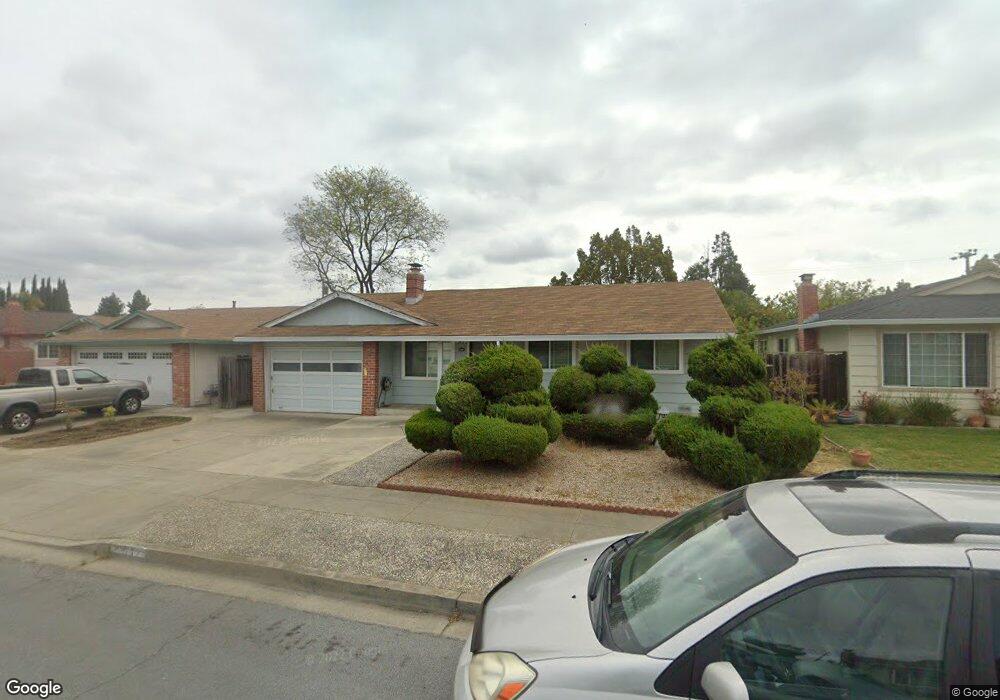
5072 Brian Ct Fremont, CA 94538
Blacow NeighborhoodEstimated Value: $1,327,000 - $1,586,000
3
Beds
2
Baths
1,078
Sq Ft
$1,320/Sq Ft
Est. Value
About This Home
This home is located at 5072 Brian Ct, Fremont, CA 94538 and is currently estimated at $1,423,076, approximately $1,320 per square foot. 5072 Brian Ct is a home located in Alameda County with nearby schools including Steven Millard Elementary, G.M. Walters Middle School, and John F. Kennedy High School.
Ownership History
Date
Name
Owned For
Owner Type
Purchase Details
Closed on
Aug 17, 2021
Sold by
Wen Ericson C C and Wen Jenny Le
Bought by
Wen Ericson C C and Wen Jenny Le
Current Estimated Value
Home Financials for this Owner
Home Financials are based on the most recent Mortgage that was taken out on this home.
Original Mortgage
$548,000
Outstanding Balance
$498,302
Interest Rate
2.9%
Mortgage Type
New Conventional
Estimated Equity
$924,774
Purchase Details
Closed on
Oct 27, 2018
Sold by
Le Wen Ericson C C and Le Wen Jenny
Bought by
Le Wen Ericson C C and Le Wen Jenny
Purchase Details
Closed on
Feb 4, 2013
Sold by
Wen Ericson
Bought by
Wen Ericson and Wen Jenny
Home Financials for this Owner
Home Financials are based on the most recent Mortgage that was taken out on this home.
Original Mortgage
$240,000
Interest Rate
3.34%
Mortgage Type
New Conventional
Purchase Details
Closed on
Nov 15, 2000
Sold by
Windham Needham A and Windham Hitomi F
Bought by
Wen Ericson
Home Financials for this Owner
Home Financials are based on the most recent Mortgage that was taken out on this home.
Original Mortgage
$160,000
Interest Rate
7.86%
Purchase Details
Closed on
Jun 7, 1996
Sold by
Va
Bought by
Windham Needham A and Windham Hitomi F
Create a Home Valuation Report for This Property
The Home Valuation Report is an in-depth analysis detailing your home's value as well as a comparison with similar homes in the area
Home Values in the Area
Average Home Value in this Area
Purchase History
| Date | Buyer | Sale Price | Title Company |
|---|---|---|---|
| Wen Ericson C C | -- | None Available | |
| Wen Ericson C C | -- | Atlas Title Company | |
| Le Wen Ericson C C | -- | None Available | |
| Wen Ericson | -- | First American Title | |
| Wen Ericson | $375,000 | American Title Co | |
| Windham Needham A | -- | -- |
Source: Public Records
Mortgage History
| Date | Status | Borrower | Loan Amount |
|---|---|---|---|
| Open | Wen Ericson C C | $548,000 | |
| Closed | Wen Ericson | $240,000 | |
| Closed | Wen Ericson | $160,000 |
Source: Public Records
Tax History Compared to Growth
Tax History
| Year | Tax Paid | Tax Assessment Tax Assessment Total Assessment is a certain percentage of the fair market value that is determined by local assessors to be the total taxable value of land and additions on the property. | Land | Improvement |
|---|---|---|---|---|
| 2025 | $7,102 | $818,223 | $169,507 | $648,716 |
| 2024 | $7,102 | $553,945 | $166,183 | $387,762 |
| 2023 | $6,905 | $543,085 | $162,925 | $380,160 |
| 2022 | $6,806 | $532,440 | $159,732 | $372,708 |
| 2021 | $6,643 | $522,000 | $156,600 | $365,400 |
| 2020 | $6,627 | $516,648 | $154,994 | $361,654 |
| 2019 | $6,554 | $506,520 | $151,956 | $354,564 |
| 2018 | $6,426 | $496,590 | $148,977 | $347,613 |
| 2017 | $6,266 | $486,854 | $146,056 | $340,798 |
| 2016 | $6,155 | $477,310 | $143,193 | $334,117 |
| 2015 | $6,069 | $470,144 | $141,043 | $329,101 |
| 2014 | $5,962 | $460,938 | $138,281 | $322,657 |
Source: Public Records
Map
Nearby Homes
- 5624 Chestnut Common
- 5531 Cosmos Common Unit 116
- 5580 Hemlock Terrace
- 5149 Roycroft Way
- 4744 Bach Ct
- 4759 Stevenson Blvd
- 40803 Blacow Rd
- 4572 De Silva St
- 5341 Audubon Park Ct
- 4751 Wadsworth Ct
- 4619 Victoria Ave
- 40696 Robin St
- 4692 Nelson St
- 39997 Cedar Blvd Unit 153
- 4453 Porter St
- 4600 Nelson St
- 39857 Pelton Terrace
- 4860 Bryce Canyon Park Dr
- 4421 Cahill St
- 4415 Burney Way