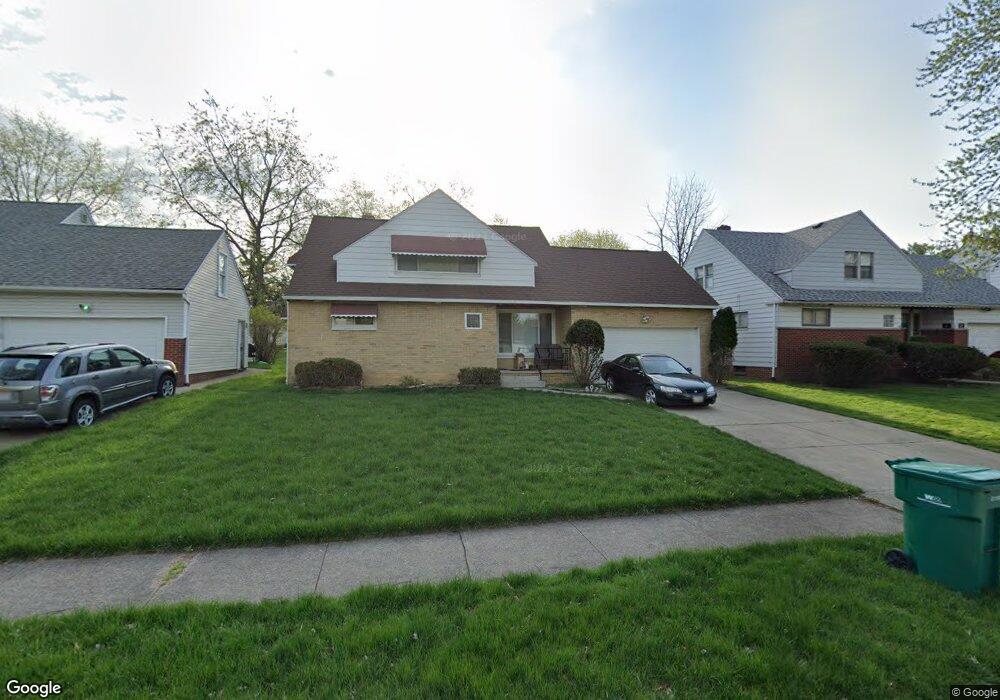
5073 Clement Ave Maple Heights, OH 44137
Estimated Value: $125,322 - $148,000
4
Beds
2
Baths
914
Sq Ft
$145/Sq Ft
Est. Value
About This Home
This home is located at 5073 Clement Ave, Maple Heights, OH 44137 and is currently estimated at $132,081, approximately $144 per square foot. 5073 Clement Ave is a home located in Cuyahoga County with nearby schools including Abraham Lincoln Elementary School, Rockside/ J.F. Kennedy School, and Barack Obama School.
Ownership History
Date
Name
Owned For
Owner Type
Purchase Details
Closed on
Oct 2, 2023
Sold by
Unknown
Bought by
Marcia Lynne Delaughter Trust and Delaughter
Current Estimated Value
Purchase Details
Closed on
Aug 16, 1989
Sold by
Parker David
Bought by
Delaughter Colandus
Purchase Details
Closed on
Oct 14, 1988
Bought by
Parker David
Purchase Details
Closed on
Aug 12, 1987
Sold by
Williams Ivory L
Bought by
Admn Of Veterans Affairs
Purchase Details
Closed on
Feb 7, 1985
Sold by
Fudella Eugene J
Bought by
Williams Ivory L
Purchase Details
Closed on
Jul 17, 1984
Sold by
Jakab George
Bought by
Fudella Eugene J
Purchase Details
Closed on
Dec 16, 1983
Sold by
Jakab George
Bought by
Jakab George and Jakab Mary
Purchase Details
Closed on
Oct 6, 1981
Sold by
Blaha Kathryn
Bought by
Jakab George
Purchase Details
Closed on
Jan 1, 1975
Bought by
Blaha Kathryn
Create a Home Valuation Report for This Property
The Home Valuation Report is an in-depth analysis detailing your home's value as well as a comparison with similar homes in the area
Home Values in the Area
Average Home Value in this Area
Purchase History
| Date | Buyer | Sale Price | Title Company |
|---|---|---|---|
| Marcia Lynne Delaughter Trust | -- | None Listed On Document | |
| Delaughter Colandus | $65,000 | -- | |
| Parker David | -- | -- | |
| Admn Of Veterans Affairs | -- | -- | |
| Williams Ivory L | $85,900 | -- | |
| Fudella Eugene J | -- | -- | |
| Jakab George | -- | -- | |
| Jakab George | $45,000 | -- | |
| Blaha Kathryn | -- | -- |
Source: Public Records
Tax History
| Year | Tax Paid | Tax Assessment Tax Assessment Total Assessment is a certain percentage of the fair market value that is determined by local assessors to be the total taxable value of land and additions on the property. | Land | Improvement |
|---|---|---|---|---|
| 2024 | $3,339 | $36,295 | $9,065 | $27,230 |
| 2023 | $2,465 | $22,510 | $5,500 | $17,010 |
| 2022 | $2,456 | $22,510 | $5,500 | $17,010 |
| 2021 | $2,614 | $22,510 | $5,500 | $17,010 |
| 2020 | $2,242 | $17,050 | $4,170 | $12,880 |
| 2019 | $2,225 | $48,700 | $11,900 | $36,800 |
| 2018 | $2,214 | $17,050 | $4,170 | $12,880 |
| 2017 | $2,160 | $16,170 | $3,850 | $12,320 |
| 2016 | $2,086 | $16,170 | $3,850 | $12,320 |
| 2015 | $2,622 | $16,170 | $3,850 | $12,320 |
| 2014 | $2,622 | $17,790 | $4,240 | $13,550 |
Source: Public Records
Map
Nearby Homes
- 5082 Philip Ave
- 17282 Mccracken Rd
- 5204 Anthony St
- 5031 Cato St
- 5231 Philip Ave
- 5246 Philip Ave
- 5150 Arch St
- 5177 Cato St
- 5212 Catherine St
- 5062 Lee Rd
- 5210 Theodore St
- 16706 Myrtle Ave
- 16351 Glenburn Ave
- 5100 Erwin St
- 16610 Priebe Ave
- 5239 Arch St
- 16241 Glenburn Ave
- 4821 E 173rd St
- 5219 Joseph St
- 16174 Friend Ave
- 5077 Clement Ave
- 5069 Clement Ave
- 5081 Clement Ave
- 5065 Clement Ave
- 5072 Catherine St
- 5076 Catherine St
- 5068 Catherine St
- 5080 Clement Ave
- 5080 Catherine St
- 5064 Catherine St
- 5061 Clement Ave
- 5068 Clement Ave
- 5101 Clement Ave
- 5064 Clement Ave
- 5060 Catherine St
- 17111 Raymond St
- 5057 Clement Ave
- 5060 Clement Ave
- 5105 Clement Ave
- 5100 Catherine St
Your Personal Tour Guide
Ask me questions while you tour the home.