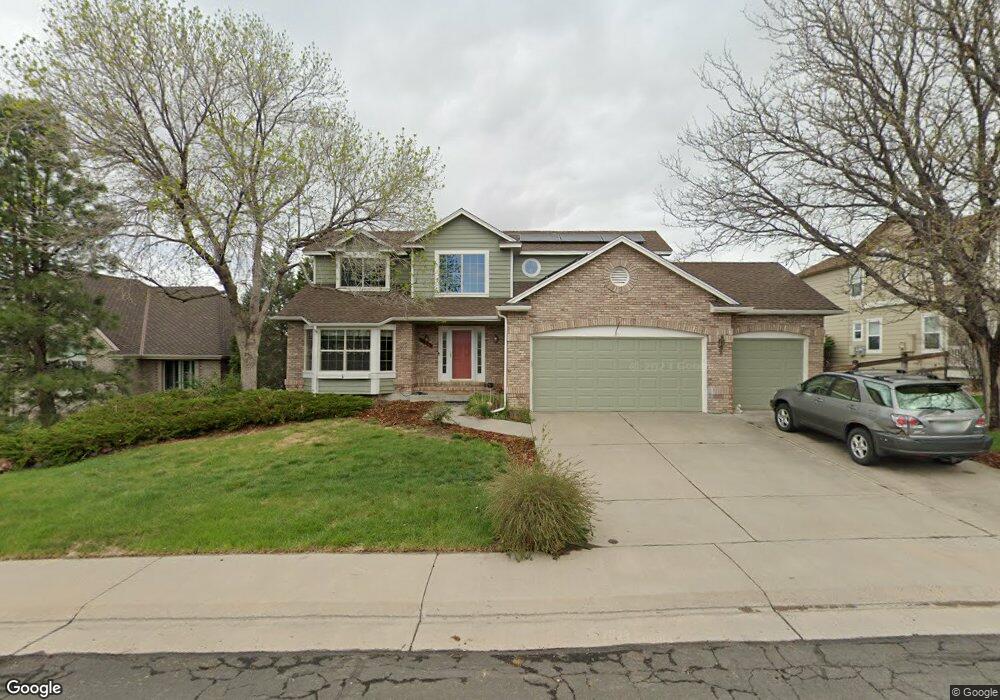
5073 Mountain Meadow Trail Castle Rock, CO 80109
The Meadows NeighborhoodEstimated Value: $752,000 - $779,000
4
Beds
4
Baths
4,232
Sq Ft
$181/Sq Ft
Est. Value
About This Home
This home is located at 5073 Mountain Meadow Trail, Castle Rock, CO 80109 and is currently estimated at $766,910, approximately $181 per square foot. 5073 Mountain Meadow Trail is a home located in Douglas County with nearby schools including Meadow View Elementary School, Castle Rock Middle School, and Castle View High School.
Ownership History
Date
Name
Owned For
Owner Type
Purchase Details
Closed on
Oct 30, 2008
Sold by
Frost Herbert H and Frost Paula A
Bought by
Sullivan Roy Joan and Roy David T
Current Estimated Value
Home Financials for this Owner
Home Financials are based on the most recent Mortgage that was taken out on this home.
Original Mortgage
$200,000
Outstanding Balance
$129,652
Interest Rate
5.83%
Mortgage Type
Unknown
Estimated Equity
$637,258
Purchase Details
Closed on
Aug 7, 2000
Sold by
Verity George W and Verity Marla G
Bought by
Frost Herbert H and Frost Paula A
Home Financials for this Owner
Home Financials are based on the most recent Mortgage that was taken out on this home.
Original Mortgage
$252,700
Interest Rate
8.21%
Mortgage Type
Balloon
Purchase Details
Closed on
Apr 3, 1991
Sold by
Virden Homes Inc
Bought by
Verity George W and Verity Marla G
Purchase Details
Closed on
Oct 26, 1988
Sold by
Castle Meadows Inc
Bought by
Virden Homes Inc
Create a Home Valuation Report for This Property
The Home Valuation Report is an in-depth analysis detailing your home's value as well as a comparison with similar homes in the area
Home Values in the Area
Average Home Value in this Area
Purchase History
| Date | Buyer | Sale Price | Title Company |
|---|---|---|---|
| Sullivan Roy Joan | $357,500 | Title America | |
| Frost Herbert H | $281,000 | -- | |
| Verity George W | $165,000 | -- | |
| Virden Homes Inc | $58,000 | -- |
Source: Public Records
Mortgage History
| Date | Status | Borrower | Loan Amount |
|---|---|---|---|
| Open | Sullivan Roy Joan | $200,000 | |
| Previous Owner | Frost Herbert H | $252,700 |
Source: Public Records
Tax History Compared to Growth
Tax History
| Year | Tax Paid | Tax Assessment Tax Assessment Total Assessment is a certain percentage of the fair market value that is determined by local assessors to be the total taxable value of land and additions on the property. | Land | Improvement |
|---|---|---|---|---|
| 2024 | $5,031 | $51,930 | $12,910 | $39,020 |
| 2023 | $5,078 | $51,930 | $12,910 | $39,020 |
| 2022 | $3,575 | $35,180 | $9,030 | $26,150 |
| 2021 | $3,713 | $35,180 | $9,030 | $26,150 |
| 2020 | $3,500 | $33,940 | $7,800 | $26,140 |
| 2019 | $3,511 | $33,940 | $7,800 | $26,140 |
| 2018 | $3,167 | $30,100 | $5,930 | $24,170 |
| 2017 | $2,988 | $30,100 | $5,930 | $24,170 |
| 2016 | $2,883 | $28,550 | $5,790 | $22,760 |
| 2015 | $2,937 | $28,550 | $5,790 | $22,760 |
| 2014 | $1,344 | $24,670 | $4,780 | $19,890 |
Source: Public Records
Map
Nearby Homes
- 4665 Bobolink Dr
- 4688 Cedar Glen Place
- 4731 Sunridge Terrace Dr
- 4432 W Mountain Vista Ln
- 4472 W Mountain Vista Ln
- 5018 Apache Creek Rd
- 4985 Bear Paw Dr
- 4310 Old Windmill Way
- 4467 Trailside Ln
- 4337 Broken Hill Dr
- 5071 Buttercup Dr
- 5045 Stonecrop Cir
- 3572 Elk Run Dr
- 4090 Forever Cir
- 2360 Charlford Ln Unit 60
- 4061 Forever Cir
- 3644 Sunridge Terrace Dr
- 3968 Tangerine Ct
- 3879 Primrose Ln
- 3797 Windriver Trail
- 5053 Mountain Meadow Trail
- 5093 Mountain Meadow Trail
- 5064 Mountain Meadow Trail
- 5123 Mountain Meadow Trail
- 5023 Mountain Meadow Trail
- 5034 Mountain Meadow Trail
- 5094 Mountain Meadow Trail
- 5114 Mountain Meadow Trail
- 5143 Mountain Meadow Trail
- 5055 Buena Vista Blvd
- 4993 Mountain Meadow Trail
- 5085 Buena Vista Blvd
- 5025 Buena Vista Blvd
- 5115 Buena Vista Blvd
- 5144 Mountain Meadow Trail
- 5163 Mountain Meadow Trail
- 5145 Buena Vista Blvd
- 5174 Mountain Meadow Trail
- 5056 Buena Vista Blvd
- 5173 Mountain Meadow Trail