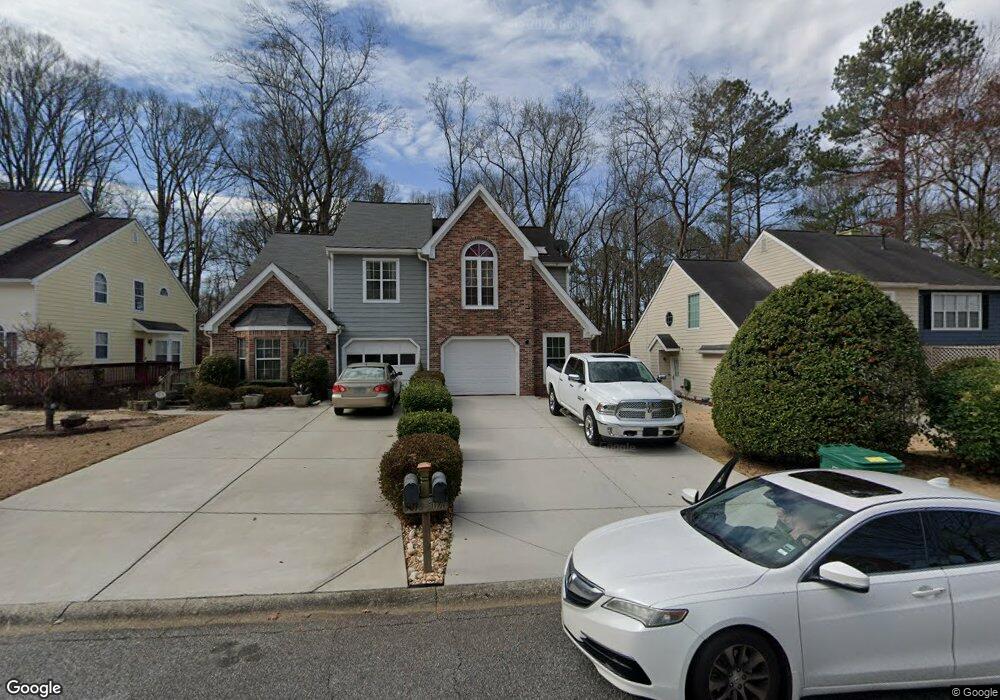
5076 Laurel Bridge Dr SE Smyrna, GA 30082
Estimated Value: $275,777 - $328,000
2
Beds
3
Baths
1,356
Sq Ft
$215/Sq Ft
Est. Value
About This Home
This home is located at 5076 Laurel Bridge Dr SE, Smyrna, GA 30082 and is currently estimated at $291,694, approximately $215 per square foot. 5076 Laurel Bridge Dr SE is a home located in Cobb County with nearby schools including Nickajack Elementary School, Griffin Middle School, and Campbell High School.
Ownership History
Date
Name
Owned For
Owner Type
Purchase Details
Closed on
Dec 5, 2016
Sold by
Neeley Delores S
Bought by
Patterson Wilzena
Current Estimated Value
Home Financials for this Owner
Home Financials are based on the most recent Mortgage that was taken out on this home.
Original Mortgage
$132,540
Outstanding Balance
$106,807
Interest Rate
3.54%
Mortgage Type
New Conventional
Estimated Equity
$184,887
Purchase Details
Closed on
Jun 23, 1999
Sold by
Stansbury James A
Bought by
Neeley Delores S
Home Financials for this Owner
Home Financials are based on the most recent Mortgage that was taken out on this home.
Original Mortgage
$100,000
Interest Rate
7.23%
Mortgage Type
New Conventional
Purchase Details
Closed on
Apr 30, 1998
Sold by
Farr Thomas J
Bought by
Stansbury James A
Home Financials for this Owner
Home Financials are based on the most recent Mortgage that was taken out on this home.
Original Mortgage
$94,400
Interest Rate
7.03%
Mortgage Type
New Conventional
Purchase Details
Closed on
Dec 27, 1996
Sold by
Forrest Sylvia
Bought by
Farr Thomas J
Purchase Details
Closed on
Aug 28, 1995
Sold by
Johnson Clarence
Bought by
Forrest Sylvia
Create a Home Valuation Report for This Property
The Home Valuation Report is an in-depth analysis detailing your home's value as well as a comparison with similar homes in the area
Home Values in the Area
Average Home Value in this Area
Purchase History
| Date | Buyer | Sale Price | Title Company |
|---|---|---|---|
| Patterson Wilzena | $141,000 | -- | |
| Neeley Delores S | $125,000 | -- | |
| Stansbury James A | $118,000 | -- | |
| Farr Thomas J | $113,200 | -- | |
| Forrest Sylvia | $94,500 | -- |
Source: Public Records
Mortgage History
| Date | Status | Borrower | Loan Amount |
|---|---|---|---|
| Open | Patterson Wilzena | $132,540 | |
| Previous Owner | Neeley Delores S | $100,000 | |
| Previous Owner | Stansbury James A | $94,400 | |
| Closed | Forrest Sylvia | $0 |
Source: Public Records
Tax History Compared to Growth
Tax History
| Year | Tax Paid | Tax Assessment Tax Assessment Total Assessment is a certain percentage of the fair market value that is determined by local assessors to be the total taxable value of land and additions on the property. | Land | Improvement |
|---|---|---|---|---|
| 2025 | $653 | $144,968 | $24,000 | $120,968 |
| 2024 | $653 | $144,968 | $24,000 | $120,968 |
| 2023 | $501 | $118,216 | $20,000 | $98,216 |
| 2022 | $653 | $99,060 | $20,000 | $79,060 |
| 2021 | $666 | $99,060 | $20,000 | $79,060 |
| 2020 | $2,397 | $87,200 | $18,000 | $69,200 |
| 2019 | $2,263 | $82,312 | $18,000 | $64,312 |
| 2018 | $1,991 | $72,412 | $16,000 | $56,412 |
| 2017 | $1,455 | $56,400 | $6,800 | $49,600 |
| 2016 | $1,186 | $45,976 | $8,000 | $37,976 |
| 2015 | $923 | $34,968 | $7,200 | $27,768 |
| 2014 | $932 | $34,968 | $0 | $0 |
Source: Public Records
Map
Nearby Homes
- 5188 Laurel Bridge Ct SE
- 1631 Wehunt Place SE Unit 14
- 5162 Laurel Bridge Ct SE
- 5033 David Place SE
- 1652 Wehunt Place SE Unit 26
- 308 Holbrook Rd Unit 11
- 4781 Highside Way SE
- 1292 Creekside Terrace SE
- 1286 Creekside Terrace SE
- 1266 Creekside Terrace SE
- 0 Gaylor St Unit 10203409
- 0 Gaylor St Unit 7275195
- 1222 Creekside Place SE
- 1554 Cooper Lake Rd SE
- 4901 Prince Rd SE
- 2158 Berryhill Cir SE
- 4343 Ivy Glen Ct SE
- 4368 Laurel Cir SE
- 1706 Durley Down Ct SE
- 4931 Durley Ln SE
- 5074 Laurel Bridge Dr SE
- 5080 Laurel Bridge Dr SE
- 5078 Laurel Bridge Dr SE
- 5072 Laurel Bridge Dr SE Unit N/a
- 5072 Laurel Bridge Dr SE
- 5082 Laurel Bridge Dr SE
- 5070 Laurel Bridge Dr SE Unit 3
- 5068 Laurel Bridge Dr SE
- 5084 Laurel Bridge Dr SE
- 5086 Laurel Bridge Dr SE
- 5066 Laurel Bridge Dr SE
- 5106 Laurel Bridge Dr SE
- 5064 Laurel Bridge Dr SE
- 5108 Laurel Bridge Dr SE Unit n/a
- 5108 Laurel Bridge Dr SE
- 5104 Laurel Bridge Dr SE
- 5110 Laurel Bridge Dr SE
- 5112 Laurel Bridge Dr SE
- 5088 Laurel Bridge Dr SE
- 5090 Laurel Bridge Dr SE