Estimated Value: $95,235 - $148,000
2
Beds
1
Bath
580
Sq Ft
$201/Sq Ft
Est. Value
About This Home
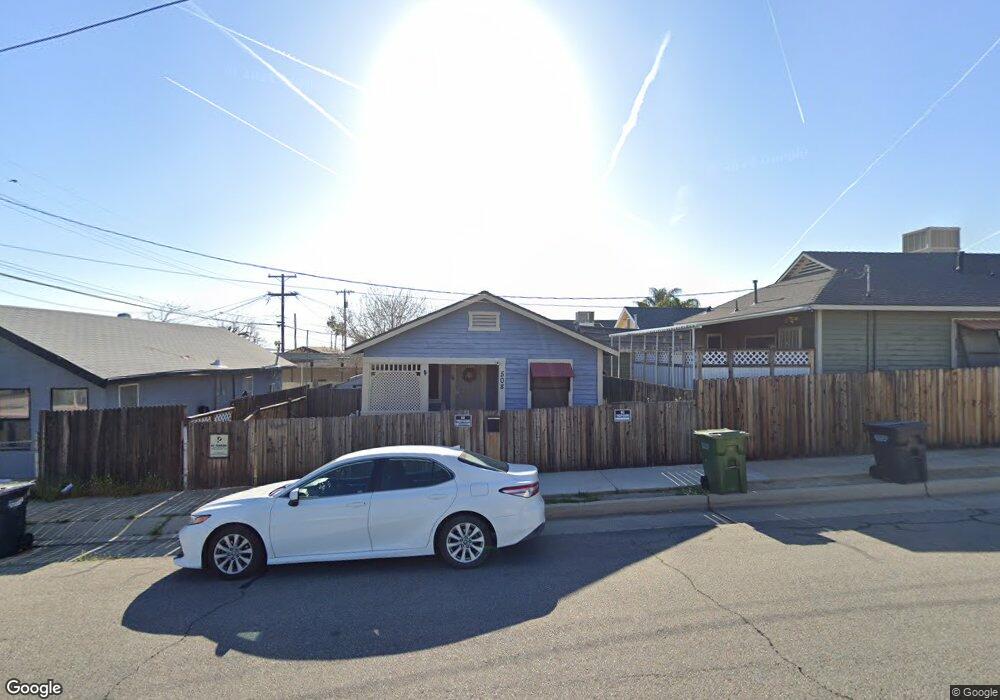
This home is located at 508 5th St, Taft, CA 93268 and is currently estimated at $116,309, approximately $200 per square foot. 508 5th St is a home located in Kern County with nearby schools including Taft Primary School, Roosevelt Elementary School, and Lincoln Junior High School.
Ownership History
Date
Name
Owned For
Owner Type
Purchase Details
Closed on
May 19, 2008
Sold by
Carmical Deborah Nadine and Trout Deborah N
Bought by
Carmical Michael Ross and Carmical Deborah Nadine
Current Estimated Value
Purchase Details
Closed on
Sep 30, 2002
Sold by
Sheppard Belva D and Robinson Mary
Bought by
Trout Deborah N
Home Financials for this Owner
Home Financials are based on the most recent Mortgage that was taken out on this home.
Original Mortgage
$50,000
Interest Rate
5.95%
Mortgage Type
Seller Take Back
Create a Home Valuation Report for This Property
The Home Valuation Report is an in-depth analysis detailing your home's value as well as a comparison with similar homes in the area
Home Values in the Area
Average Home Value in this Area
Purchase History
We collect this data history from publicly available records. To have your information removed, we recommend requesting removal directly through your county’s website.
| Date | Buyer | Sale Price | Title Company |
|---|---|---|---|
| Carmical Michael Ross | -- | None Available | |
| Trout Deborah N | $50,000 | Fidelity |
Source: Public Records
Mortgage History
We collect this data history from publicly available records. To have your information removed, we recommend requesting removal directly through your county’s website.
| Date | Status | Borrower | Loan Amount |
|---|---|---|---|
| Previous Owner | Trout Deborah N | $50,000 |
Source: Public Records
Tax History
| Year | Tax Paid | Tax Assessment Tax Assessment Total Assessment is a certain percentage of the fair market value that is determined by local assessors to be the total taxable value of land and additions on the property. | Land | Improvement |
|---|---|---|---|---|
| 2025 | $1,641 | $28,940 | $14,470 | $14,470 |
| 2024 | $1,490 | $28,374 | $14,187 | $14,187 |
| 2023 | $1,490 | $27,818 | $13,909 | $13,909 |
| 2022 | $1,365 | $27,274 | $13,637 | $13,637 |
| 2021 | $1,221 | $26,740 | $13,370 | $13,370 |
| 2020 | $1,043 | $26,466 | $13,233 | $13,233 |
| 2019 | $1,038 | $26,466 | $13,233 | $13,233 |
| 2018 | $1,030 | $25,440 | $12,720 | $12,720 |
| 2017 | $1,018 | $24,942 | $12,471 | $12,471 |
| 2016 | $1,001 | $24,454 | $12,227 | $12,227 |
| 2015 | $933 | $24,088 | $12,044 | $12,044 |
| 2014 | $875 | $23,618 | $11,809 | $11,809 |
Source: Public Records
Map
Nearby Homes
Your Personal Tour Guide
Ask me questions while you tour the home.