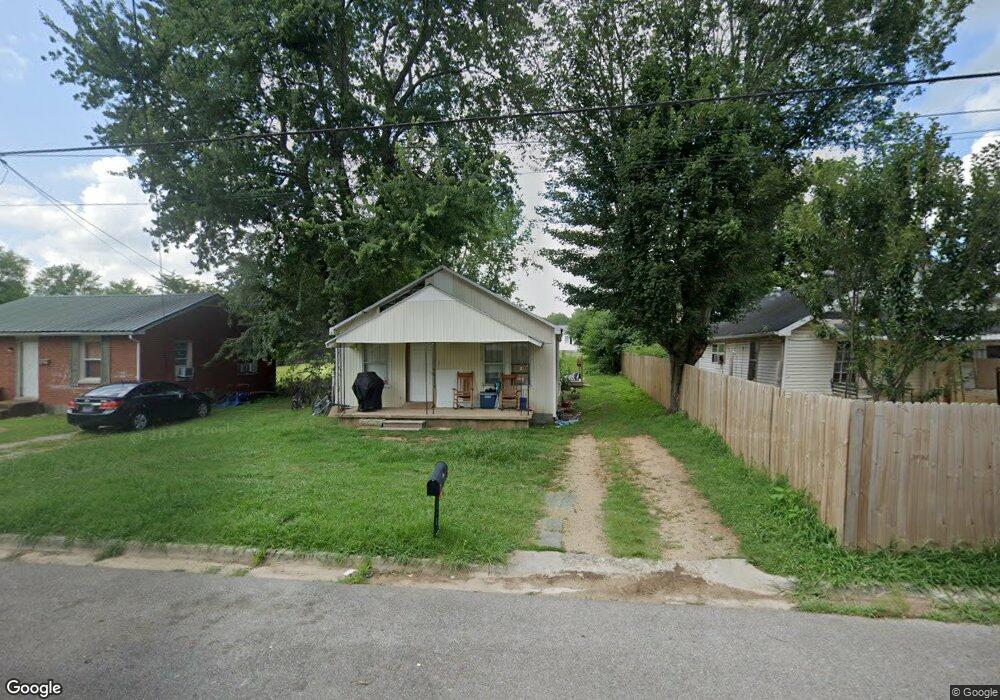
508 6th St Lawrenceburg, TN 38464
Estimated Value: $105,298 - $169,000
--
Bed
1
Bath
1,056
Sq Ft
$128/Sq Ft
Est. Value
About This Home
This home is located at 508 6th St, Lawrenceburg, TN 38464 and is currently estimated at $135,325, approximately $128 per square foot. 508 6th St is a home located in Lawrence County with nearby schools including Ingram Sowell Elementary School, Lawrenceburg Public Elementary School, and David Crockett Elementary School.
Ownership History
Date
Name
Owned For
Owner Type
Purchase Details
Closed on
Apr 29, 2004
Bought by
Cooke Elmer and Cooke Peggy
Current Estimated Value
Purchase Details
Closed on
Apr 23, 2004
Bought by
Robertson Stanley Dale
Purchase Details
Closed on
Apr 22, 2004
Bought by
Cooke Elmer and Cooke Peggy B
Purchase Details
Closed on
Sep 1, 1998
Bought by
Cooke Peggy Ann
Purchase Details
Closed on
Oct 25, 1995
Bought by
Pierce Carlos L
Purchase Details
Closed on
Mar 7, 1991
Bought by
Cooke Peggy Ann
Purchase Details
Closed on
Jan 22, 1990
Bought by
Cook John
Purchase Details
Closed on
Dec 19, 1986
Bought by
Flippo Larry and Wife Maudie
Create a Home Valuation Report for This Property
The Home Valuation Report is an in-depth analysis detailing your home's value as well as a comparison with similar homes in the area
Home Values in the Area
Average Home Value in this Area
Purchase History
| Date | Buyer | Sale Price | Title Company |
|---|---|---|---|
| Cooke Elmer | -- | -- | |
| Robertson Stanley Dale | $7,500 | -- | |
| Cooke Elmer | -- | -- | |
| Cooke Peggy Ann | $2,500 | -- | |
| Pierce Carlos L | $22,500 | -- | |
| Cooke Peggy Ann | $8,000 | -- | |
| Cook John | $5,500 | -- | |
| Flippo Larry | -- | -- |
Source: Public Records
Tax History Compared to Growth
Tax History
| Year | Tax Paid | Tax Assessment Tax Assessment Total Assessment is a certain percentage of the fair market value that is determined by local assessors to be the total taxable value of land and additions on the property. | Land | Improvement |
|---|---|---|---|---|
| 2025 | $479 | $15,425 | $0 | $0 |
| 2024 | $479 | $15,425 | $1,500 | $13,925 |
| 2023 | $479 | $15,425 | $1,500 | $13,925 |
| 2022 | $479 | $15,425 | $1,500 | $13,925 |
| 2021 | $386 | $8,800 | $1,500 | $7,300 |
| 2020 | $386 | $8,800 | $1,500 | $7,300 |
| 2019 | $386 | $8,800 | $1,500 | $7,300 |
| 2018 | $386 | $8,800 | $1,500 | $7,300 |
| 2017 | $386 | $8,800 | $1,500 | $7,300 |
| 2016 | $386 | $8,800 | $1,500 | $7,300 |
| 2015 | $366 | $8,800 | $1,500 | $7,300 |
| 2014 | $329 | $7,900 | $1,500 | $6,400 |
Source: Public Records
Map
Nearby Homes