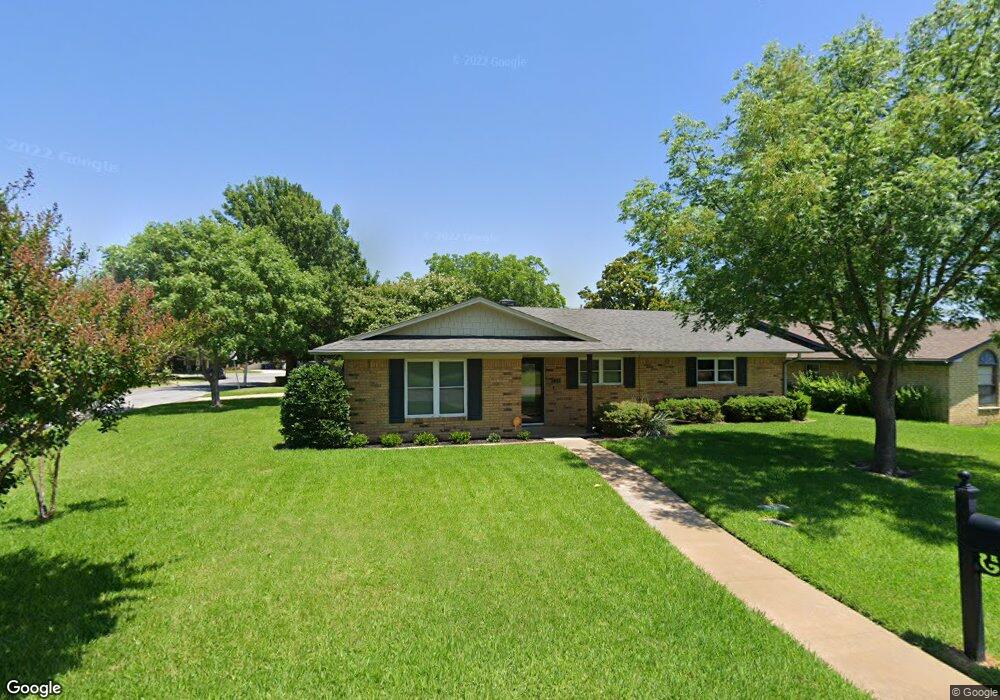
508 Bryan Dr Denison, TX 75020
Estimated Value: $253,188 - $281,000
3
Beds
2
Baths
1,896
Sq Ft
$141/Sq Ft
Est. Value
About This Home
This home is located at 508 Bryan Dr, Denison, TX 75020 and is currently estimated at $267,094, approximately $140 per square foot. 508 Bryan Dr is a home located in Grayson County with nearby schools including Mayes Elementary School, Scott Middle School, and Denison High School.
Ownership History
Date
Name
Owned For
Owner Type
Purchase Details
Closed on
Jun 9, 2022
Sold by
Tiner Ridinger Marie Beckham
Bought by
Ridinger William Paul
Current Estimated Value
Purchase Details
Closed on
Jun 8, 2022
Sold by
Ridinger Marie Beckham Tiner
Bought by
Ridinger William Paul
Purchase Details
Closed on
May 15, 2012
Sold by
Herriage William Randall
Bought by
Tiner Marie Beckham
Home Financials for this Owner
Home Financials are based on the most recent Mortgage that was taken out on this home.
Original Mortgage
$75,000
Interest Rate
4.02%
Mortgage Type
New Conventional
Purchase Details
Closed on
Feb 28, 2006
Sold by
Herriage Bobby G
Bought by
Herriage William Randall
Home Financials for this Owner
Home Financials are based on the most recent Mortgage that was taken out on this home.
Original Mortgage
$73,000
Interest Rate
6.09%
Mortgage Type
Seller Take Back
Create a Home Valuation Report for This Property
The Home Valuation Report is an in-depth analysis detailing your home's value as well as a comparison with similar homes in the area
Home Values in the Area
Average Home Value in this Area
Purchase History
| Date | Buyer | Sale Price | Title Company |
|---|---|---|---|
| Ridinger William Paul | -- | None Listed On Document | |
| Ridinger William Paul | -- | None Listed On Document | |
| Tiner Marie Beckham | -- | Grayson County Title | |
| Herriage William Randall | -- | None Available |
Source: Public Records
Mortgage History
| Date | Status | Borrower | Loan Amount |
|---|---|---|---|
| Previous Owner | Tiner Marie Beckham | $75,000 | |
| Previous Owner | Herriage William Randall | $73,000 |
Source: Public Records
Tax History
| Year | Tax Paid | Tax Assessment Tax Assessment Total Assessment is a certain percentage of the fair market value that is determined by local assessors to be the total taxable value of land and additions on the property. | Land | Improvement |
|---|---|---|---|---|
| 2025 | $1,152 | $270,119 | $54,686 | $215,433 |
| 2024 | $5,906 | $254,203 | $0 | $0 |
| 2023 | $1,152 | $231,094 | $0 | $0 |
| 2022 | $4,991 | $210,085 | $0 | $0 |
| 2021 | $4,817 | $190,986 | $31,988 | $158,998 |
| 2020 | $5,121 | $194,157 | $18,676 | $175,481 |
| 2019 | $5,173 | $187,987 | $18,676 | $169,311 |
| 2018 | $4,820 | $173,765 | $15,419 | $158,346 |
| 2017 | $4,513 | $164,490 | $13,791 | $150,699 |
| 2016 | $1,969 | $153,033 | $13,217 | $139,816 |
| 2015 | $1,969 | $133,306 | $9,003 | $124,303 |
| 2014 | $2,119 | $130,555 | $9,003 | $121,552 |
Source: Public Records
Map
Nearby Homes
- 509 Bryan Dr
- Flora ,TBD Flora Ln
- 2508 W Crawford St
- TBD W Crawford St
- 2603 Brookhaven Dr
- 2105 W Crawford St
- 2408 Miller St
- 2385 Miller St
- 201 Ross Ave
- 713 Briarwood Dr
- 2500 Brookhaven Dr
- 218 Jenny Ln
- 600 Ambassador St
- 104 N Imperial Dr
- 2331 Brookhaven Dr
- 112 N Imperial Dr
- 901 Waterloo Lake Dr
- 22 Haven Cir
- 110 S Hickory Ave
- 931 Waterloo Lake Dr
Your Personal Tour Guide
Ask me questions while you tour the home.