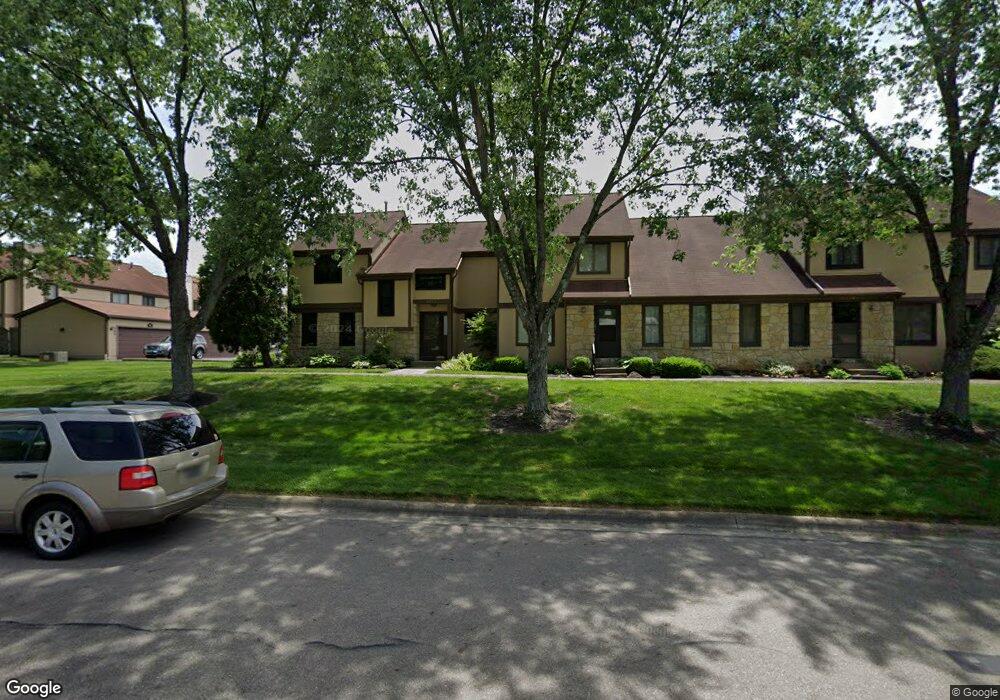
508 Camdenway Ct Unit D Columbus, OH 43213
Olde Orchard NeighborhoodEstimated Value: $191,917 - $225,000
2
Beds
2
Baths
1,264
Sq Ft
$162/Sq Ft
Est. Value
About This Home
This home is located at 508 Camdenway Ct Unit D, Columbus, OH 43213 and is currently estimated at $204,729, approximately $161 per square foot. 508 Camdenway Ct Unit D is a home located in Franklin County with nearby schools including Olde Orchard Elementary School, Sherwood Middle School, and Walnut Ridge High School.
Ownership History
Date
Name
Owned For
Owner Type
Purchase Details
Closed on
Nov 22, 2021
Sold by
Brus Helena B
Bought by
Brus Helena B and Helena B Brus Trust
Current Estimated Value
Purchase Details
Closed on
Feb 5, 2008
Sold by
Wells Fargo Bank Na
Bought by
Brus Helena B
Home Financials for this Owner
Home Financials are based on the most recent Mortgage that was taken out on this home.
Original Mortgage
$86,000
Outstanding Balance
$53,360
Interest Rate
5.75%
Mortgage Type
Purchase Money Mortgage
Estimated Equity
$151,369
Purchase Details
Closed on
Oct 4, 2007
Sold by
Wasserman Susan and Prather Keitha M
Bought by
Wells Fargo Bank Na and Mlmi Trust Series 2005-Ff6
Purchase Details
Closed on
Mar 22, 1990
Bought by
Prather Keitha M
Purchase Details
Closed on
Dec 8, 1988
Create a Home Valuation Report for This Property
The Home Valuation Report is an in-depth analysis detailing your home's value as well as a comparison with similar homes in the area
Home Values in the Area
Average Home Value in this Area
Purchase History
| Date | Buyer | Sale Price | Title Company |
|---|---|---|---|
| Brus Helena B | -- | None Available | |
| Brus Helena B | $86,000 | Resource | |
| Wells Fargo Bank Na | $114,000 | Attorney | |
| Prather Keitha M | -- | -- | |
| -- | $87,000 | -- |
Source: Public Records
Mortgage History
| Date | Status | Borrower | Loan Amount |
|---|---|---|---|
| Open | Brus Helena B | $86,000 |
Source: Public Records
Tax History Compared to Growth
Tax History
| Year | Tax Paid | Tax Assessment Tax Assessment Total Assessment is a certain percentage of the fair market value that is determined by local assessors to be the total taxable value of land and additions on the property. | Land | Improvement |
|---|---|---|---|---|
| 2024 | $1,960 | $53,480 | $11,900 | $41,580 |
| 2023 | $1,963 | $53,480 | $11,900 | $41,580 |
| 2022 | $1,454 | $36,790 | $6,160 | $30,630 |
| 2021 | $1,457 | $36,790 | $6,160 | $30,630 |
| 2020 | $1,914 | $36,790 | $6,160 | $30,630 |
| 2019 | $1,716 | $28,290 | $4,730 | $23,560 |
| 2018 | $1,551 | $28,290 | $4,730 | $23,560 |
| 2017 | $1,623 | $28,290 | $4,730 | $23,560 |
| 2016 | $1,530 | $23,100 | $5,740 | $17,360 |
| 2015 | $1,389 | $23,100 | $5,740 | $17,360 |
| 2014 | $1,393 | $23,100 | $5,740 | $17,360 |
| 2013 | $687 | $23,100 | $5,740 | $17,360 |
Source: Public Records
Map
Nearby Homes
- 541 Woodingham Place Unit 2-C
- 557 Woodingham Place Unit 1A
- 6279 Braiden Ct Unit 10B
- 6056 Naughten Pond Dr
- 6258 Peach Tree Rd
- 6052 Naughten Pond Dr
- 6040 Naughten Pond Dr
- 6231 Peach Tree Rd
- Oxford Plan at Icon Villas at McNaughten
- Ashton Plan at Icon Villas at McNaughten
- 6560 Schenk Ave
- 834 Persimmon Place
- 187 McNaughten Rd
- 696 Hunt Valley Dr
- 6193 Stornoway Dr S Unit 6193
- 6033 McNaughten Grove Ln
- 807 McNaughten Rd
- 6610 Olivetree Ct
- 117 Stornoway Dr E
- 6198 Stornoway Dr S Unit 6198
- 508 Camdenway Ct Unit 45D
- 510 Camdenway Ct Unit 45C
- 512 Camdenway Ct Unit 45B
- 512 Camdenway Ct Unit B
- 6283 Billington Dr
- 6283 Billington Dr Unit A
- 489 Durbin Rd Unit 44B
- 489 Durbin Rd Unit B
- 491 Durbin Rd Unit 44A
- 491 Durbin Rd Unit A
- 514 Camdenway Ct
- 514 Camdenway Ct Unit A
- 6281 Billington Dr Unit 43B
- 6281 Billington Dr
- 487 Durbin Rd
- 487 Durbin Rd Unit C
- 6279 Billington Dr Unit 43C
- 6279 Billington Dr Unit C
- 526 Camdenway Ct
- 6309 Sabastian Ct