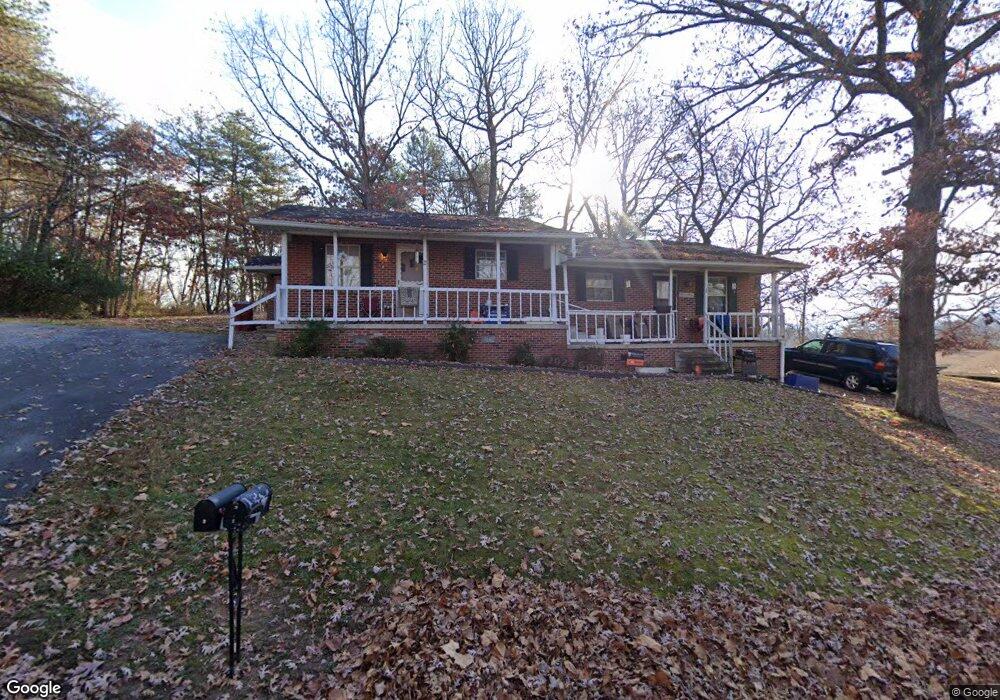
508 Dennis Dr Johnson City, TN 37601
Estimated Value: $220,879 - $255,000
--
Bed
2
Baths
2,040
Sq Ft
$114/Sq Ft
Est. Value
About This Home
This home is located at 508 Dennis Dr, Johnson City, TN 37601 and is currently estimated at $232,293, approximately $113 per square foot. 508 Dennis Dr is a home located in Washington County with nearby schools including Mountain View Elementary School, Liberty Bell Middle School, and Indian Trail Middle School.
Ownership History
Date
Name
Owned For
Owner Type
Purchase Details
Closed on
Oct 5, 2016
Sold by
Williams Douglas A
Bought by
Williams Matthew
Current Estimated Value
Home Financials for this Owner
Home Financials are based on the most recent Mortgage that was taken out on this home.
Original Mortgage
$130,000
Outstanding Balance
$16,335
Interest Rate
3.44%
Mortgage Type
New Conventional
Estimated Equity
$215,958
Purchase Details
Closed on
Dec 7, 2000
Sold by
Jones Jack A
Bought by
Williams Douglas
Purchase Details
Closed on
Aug 30, 1998
Bought by
Appalachian Real Estate Investment
Create a Home Valuation Report for This Property
The Home Valuation Report is an in-depth analysis detailing your home's value as well as a comparison with similar homes in the area
Home Values in the Area
Average Home Value in this Area
Purchase History
| Date | Buyer | Sale Price | Title Company |
|---|---|---|---|
| Williams Matthew | $132,250 | -- | |
| Williams Douglas | $52,000 | -- | |
| Appalachian Real Estate Investment | $70,000 | -- |
Source: Public Records
Mortgage History
| Date | Status | Borrower | Loan Amount |
|---|---|---|---|
| Open | Williams Matthew | $130,000 |
Source: Public Records
Tax History Compared to Growth
Tax History
| Year | Tax Paid | Tax Assessment Tax Assessment Total Assessment is a certain percentage of the fair market value that is determined by local assessors to be the total taxable value of land and additions on the property. | Land | Improvement |
|---|---|---|---|---|
| 2024 | $1,499 | $87,640 | $10,440 | $77,200 |
| 2022 | $879 | $40,880 | $5,480 | $35,400 |
| 2021 | $1,586 | $40,880 | $5,480 | $35,400 |
| 2020 | $1,578 | $40,880 | $5,480 | $35,400 |
| 2019 | $826 | $40,880 | $5,480 | $35,400 |
| 2018 | $1,482 | $34,720 | $5,480 | $29,240 |
| 2017 | $1,482 | $34,720 | $5,480 | $29,240 |
| 2016 | $1,475 | $34,720 | $5,480 | $29,240 |
| 2015 | $1,337 | $34,720 | $5,480 | $29,240 |
| 2014 | $1,250 | $34,720 | $5,480 | $29,240 |
Source: Public Records
Map
Nearby Homes
- 106 Water St
- 1009 E Main St
- 610 E Myrtle Ave
- 900 Grover St
- 414 S Roan St Unit 202
- 607 E Watauga Ave
- 102 E Walnut St
- 908 Afton St
- 200 E Main St Unit 5
- 203 E Locust St
- 116 Tipton St Unit 209
- 116 E Unaka Ave
- 102 W Locust St
- 120 E Holston Ave
- 611 E Holston Ave
- 1003 1/2 E Watauga Ave
- 1007 Spring St
- 505 Orleans St
- 112 W Chestnut St
- 907 Baxter St
- 0 Dennis Dr
- TBD Dennis Dr
- 504 Dennis Dr
- 505 Dennis Dr
- 518 Dennis Dr
- 80 New St
- 0 Chamber Dr
- 601 - 603 E Market St
- 0 E Market St
- 3102 E Market St
- TRACT 1 Chamber Dr
- 607 E Market St
- 609 E Market St
- TRACT 2 Chamber Dr
- TRACT 1 &2 Chamber Dr
- TBD W Market St
- 703 E Market St
- 707 E Market St
- 0 Tbd Water St Unit 412182
- Tbd Water St