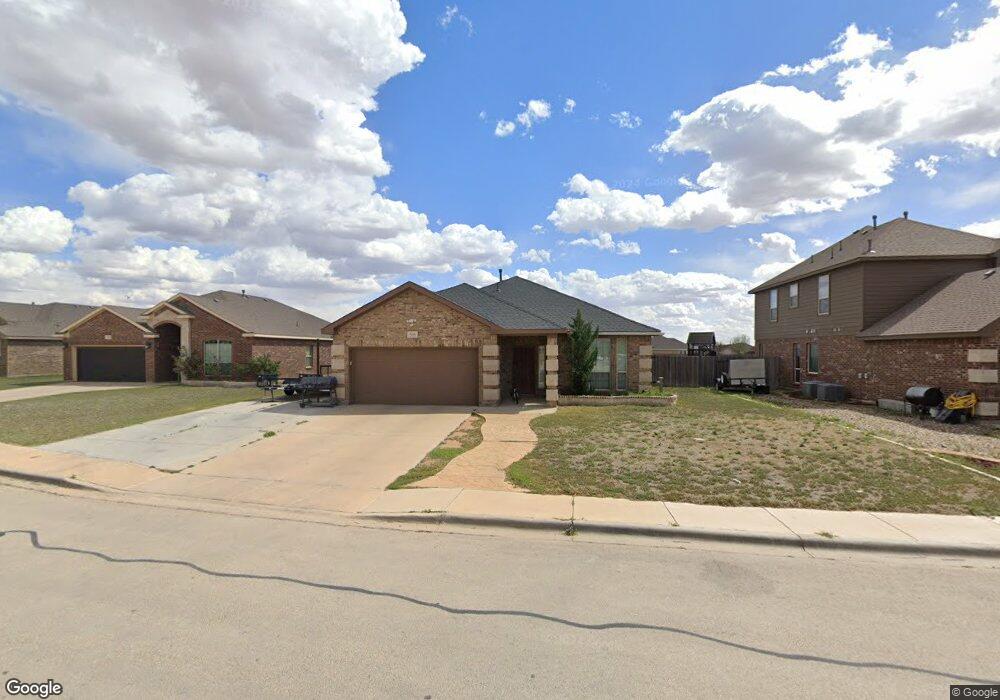
508 E 95th St Odessa, TX 79765
Estimated Value: $311,000 - $332,000
4
Beds
2
Baths
2,032
Sq Ft
$157/Sq Ft
Est. Value
About This Home
This home is located at 508 E 95th St, Odessa, TX 79765 and is currently estimated at $318,639, approximately $156 per square foot. 508 E 95th St is a home located in Ector County with nearby schools including Barbara Jordan Elementary School, Wilson & Young Medal of Honor Middle School, and Permian High School.
Ownership History
Date
Name
Owned For
Owner Type
Purchase Details
Closed on
Mar 27, 2019
Sold by
Garza Kelby
Bought by
Flores Anthony and Flores Geneva
Current Estimated Value
Home Financials for this Owner
Home Financials are based on the most recent Mortgage that was taken out on this home.
Original Mortgage
$249,185
Outstanding Balance
$218,180
Interest Rate
4.3%
Mortgage Type
FHA
Estimated Equity
$100,459
Purchase Details
Closed on
Dec 5, 2018
Sold by
Garza Yesenia Lujan
Bought by
Garza Kelby Bryant
Purchase Details
Closed on
Aug 21, 2014
Sold by
D R Horton Texas Ltd
Bought by
Garza Kelby
Home Financials for this Owner
Home Financials are based on the most recent Mortgage that was taken out on this home.
Original Mortgage
$224,265
Interest Rate
4.19%
Mortgage Type
FHA
Create a Home Valuation Report for This Property
The Home Valuation Report is an in-depth analysis detailing your home's value as well as a comparison with similar homes in the area
Purchase History
| Date | Buyer | Sale Price | Title Company |
|---|---|---|---|
| Flores Anthony | -- | Basin Abstract & Title | |
| Garza Kelby Bryant | -- | None Available | |
| Garza Kelby | -- | Basin Abstract & Title |
Source: Public Records
Mortgage History
| Date | Status | Borrower | Loan Amount |
|---|---|---|---|
| Open | Flores Anthony | $249,185 | |
| Previous Owner | Garza Kelby | $224,265 |
Source: Public Records
Tax History
| Year | Tax Paid | Tax Assessment Tax Assessment Total Assessment is a certain percentage of the fair market value that is determined by local assessors to be the total taxable value of land and additions on the property. | Land | Improvement |
|---|---|---|---|---|
| 2025 | $3,704 | $302,064 | $23,326 | $278,738 |
| 2024 | $3,879 | $288,512 | $23,326 | $265,186 |
| 2023 | $3,789 | $283,318 | $23,326 | $259,992 |
| 2022 | $6,381 | $276,187 | $23,326 | $252,861 |
| 2021 | $6,467 | $274,136 | $23,326 | $250,810 |
| 2020 | $6,230 | $268,630 | $23,326 | $245,304 |
| 2019 | $6,029 | $244,536 | $23,326 | $221,210 |
| 2018 | $5,280 | $224,247 | $23,326 | $200,921 |
| 2017 | $5,137 | $225,538 | $23,326 | $202,212 |
| 2016 | $4,898 | $220,599 | $18,387 | $202,212 |
| 2015 | -- | $221,829 | $18,387 | $203,442 |
Source: Public Records
Map
Nearby Homes
Your Personal Tour Guide
Ask me questions while you tour the home.