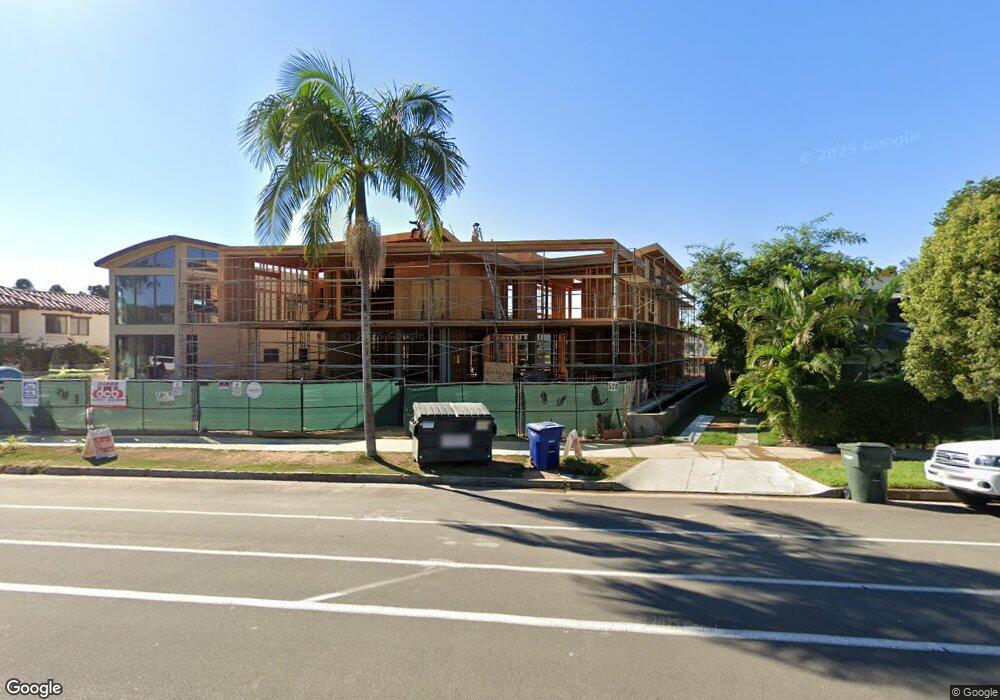
508 Glorietta Blvd Coronado, CA 92118
Estimated Value: $5,027,000 - $8,229,192
4
Beds
4
Baths
2,826
Sq Ft
$2,243/Sq Ft
Est. Value
About This Home
This home is located at 508 Glorietta Blvd, Coronado, CA 92118 and is currently estimated at $6,337,798, approximately $2,242 per square foot. 508 Glorietta Blvd is a home located in San Diego County with nearby schools including Coronado Village Elementary, Coronado Middle School, and Coronado High School.
Ownership History
Date
Name
Owned For
Owner Type
Purchase Details
Closed on
Sep 24, 2018
Sold by
Obrien Susan Parker
Bought by
Alavarez Gerado Enrique Babatz and Anel Dulce Carolina Vazquez Del
Current Estimated Value
Purchase Details
Closed on
Oct 18, 2012
Sold by
Precourt Jr Jay A
Bought by
Obrien Susan Parker
Purchase Details
Closed on
Jun 30, 1999
Sold by
Parker Richard W
Bought by
Richard W Parker Family Trust
Home Financials for this Owner
Home Financials are based on the most recent Mortgage that was taken out on this home.
Original Mortgage
$164,700
Interest Rate
7.24%
Mortgage Type
Purchase Money Mortgage
Purchase Details
Closed on
Jul 15, 1998
Sold by
Parker Ezra Meech
Bought by
Richard W Parker Family Trust
Purchase Details
Closed on
Jan 4, 1994
Sold by
Parker Ezra Meech
Bought by
Parker Richard W
Create a Home Valuation Report for This Property
The Home Valuation Report is an in-depth analysis detailing your home's value as well as a comparison with similar homes in the area
Home Values in the Area
Average Home Value in this Area
Purchase History
| Date | Buyer | Sale Price | Title Company |
|---|---|---|---|
| Alavarez Gerado Enrique Babatz | $2,500,000 | Ticor Title Company | |
| Obrien Susan Parker | -- | None Available | |
| Richard W Parker Family Trust | -- | First Southwestern Title | |
| Parker Richard W | -- | First Southwestern Title | |
| Parker Richard W | -- | First Southwestern Title | |
| Richard W Parker Family Trust | -- | -- | |
| Parker Richard W | -- | -- | |
| Parker Richard W | -- | -- |
Source: Public Records
Mortgage History
| Date | Status | Borrower | Loan Amount |
|---|---|---|---|
| Previous Owner | Parker Richard W | $164,700 |
Source: Public Records
Tax History Compared to Growth
Tax History
| Year | Tax Paid | Tax Assessment Tax Assessment Total Assessment is a certain percentage of the fair market value that is determined by local assessors to be the total taxable value of land and additions on the property. | Land | Improvement |
|---|---|---|---|---|
| 2025 | $48,180 | $5,560,259 | $2,560,259 | $3,000,000 |
| 2024 | $48,180 | $4,532,058 | $2,510,058 | $2,022,000 |
| 2023 | $38,114 | $2,412,591 | $2,412,591 | $0 |
| 2022 | $26,026 | $2,412,591 | $2,412,591 | $0 |
| 2021 | $24,600 | $2,267,247 | $2,267,247 | $0 |
| 2020 | $27,085 | $2,550,000 | $2,244,000 | $306,000 |
| 2019 | $2,587 | $184,533 | $117,078 | $67,455 |
| 2018 | $2,552 | $180,916 | $114,783 | $66,133 |
| 2017 | $2,479 | $177,370 | $112,533 | $64,837 |
| 2016 | $2,381 | $173,893 | $110,327 | $63,566 |
| 2015 | $2,314 | $171,282 | $108,670 | $62,612 |
| 2014 | $2,228 | $167,928 | $106,542 | $61,386 |
Source: Public Records
Map
Nearby Homes
- 520 Glorietta Blvd
- 504 Glorietta Blvd Unit 6
- 500 Glorietta Blvd
- 522 Glorietta Blvd
- 509 Pomona Ave
- 1533 Pendleton Rd
- 1520 5th St
- 513 Pomona Ave
- 1525 Pendleton Rd
- 526 Glorietta Blvd
- 1516 5th St
- 1519 Pendleton Rd
- 1515 Pendleton Rd
- 511 Pomona Ave
- 444 Glorietta Blvd
- 1511 Pendleton Rd
- 1530 Pendleton Rd
- 1526 Pendleton Rd
- 1515 5th St
- 517 Pomona Ave