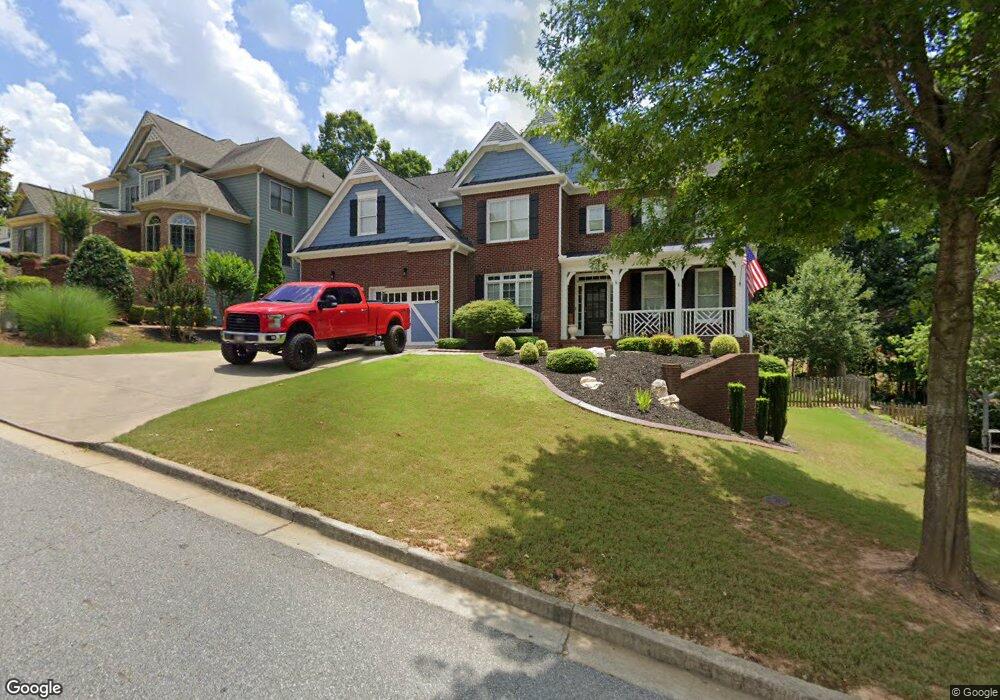
508 Highwater Pass Unit 4H Canton, GA 30114
Sutallee NeighborhoodEstimated Value: $675,943 - $789,000
5
Beds
4
Baths
3,558
Sq Ft
$206/Sq Ft
Est. Value
About This Home
This home is located at 508 Highwater Pass Unit 4H, Canton, GA 30114 and is currently estimated at $732,472, approximately $205 per square foot. 508 Highwater Pass Unit 4H is a home located in Cherokee County with nearby schools including Liberty Elementary School, Freedom Middle School, and Cherokee High School.
Ownership History
Date
Name
Owned For
Owner Type
Purchase Details
Closed on
Sep 9, 2011
Sold by
Farrell Roy
Bought by
Mule Stephanie
Current Estimated Value
Purchase Details
Closed on
May 12, 2006
Sold by
Farrell Roy E
Bought by
Mule Stephanie L
Home Financials for this Owner
Home Financials are based on the most recent Mortgage that was taken out on this home.
Original Mortgage
$200,000
Interest Rate
6.41%
Mortgage Type
New Conventional
Purchase Details
Closed on
Jan 31, 2006
Sold by
Blueridge Residential Inc
Bought by
Dove Christopher D and Dove Mary E
Home Financials for this Owner
Home Financials are based on the most recent Mortgage that was taken out on this home.
Original Mortgage
$380,000
Interest Rate
8.85%
Mortgage Type
New Conventional
Create a Home Valuation Report for This Property
The Home Valuation Report is an in-depth analysis detailing your home's value as well as a comparison with similar homes in the area
Home Values in the Area
Average Home Value in this Area
Purchase History
| Date | Buyer | Sale Price | Title Company |
|---|---|---|---|
| Mule Stephanie | -- | -- | |
| Mule Stephanie L | -- | -- | |
| Farrell Roy E | $369,900 | -- | |
| Dove Christopher D | $380,000 | -- |
Source: Public Records
Mortgage History
| Date | Status | Borrower | Loan Amount |
|---|---|---|---|
| Previous Owner | Farrell Roy E | $200,000 | |
| Previous Owner | Farrell Roy E | $132,900 | |
| Previous Owner | Dove Christopher D | $380,000 |
Source: Public Records
Tax History Compared to Growth
Tax History
| Year | Tax Paid | Tax Assessment Tax Assessment Total Assessment is a certain percentage of the fair market value that is determined by local assessors to be the total taxable value of land and additions on the property. | Land | Improvement |
|---|---|---|---|---|
| 2025 | $6,561 | $279,120 | $50,000 | $229,120 |
| 2024 | $6,297 | $267,280 | $46,000 | $221,280 |
| 2023 | $5,691 | $259,160 | $46,000 | $213,160 |
| 2022 | $5,276 | $215,840 | $36,000 | $179,840 |
| 2021 | $4,868 | $179,480 | $28,800 | $150,680 |
| 2020 | $4,601 | $167,800 | $28,800 | $139,000 |
| 2019 | $4,461 | $161,760 | $28,800 | $132,960 |
| 2018 | $4,256 | $151,880 | $27,200 | $124,680 |
| 2017 | $4,237 | $374,200 | $27,200 | $122,480 |
| 2016 | $4,068 | $355,100 | $27,200 | $114,840 |
| 2015 | $3,764 | $325,800 | $24,000 | $106,320 |
| 2014 | $3,659 | $316,300 | $24,000 | $102,520 |
Source: Public Records
Map
Nearby Homes
- 619 Blackwater Ridge
- 435 Lake Point Trace Unit 3J
- 313 Meadow Lark Crossing Unit 31
- 3092 Woodbridge Ln Unit 3L
- 251 Brookwood Dr
- 3085 Woodbridge Ln
- 227 Elmbrook Ln Unit 3L
- 113 Gold Bridge Crossing
- 510 Millwood Ct
- 601 Shelter Cove
- 520 Waterside Ct
- 429 Arrowhead Trail
- 426 Arrowhead Trail
- 1354 Bridgemill Ave
- 422 Arrowhead Trail
- 537 Oriole Farm Trail Unit 4L
- 273 Deer Valley Run
- 305 Deer Valley Run
- 309 Deer Valley Run
- 308 Deer Valley Run
- 506 Highwater Pass Unit 4H
- 510 Highwater Pass
- 601 Blackwater Ridge
- 504 Highwater Pass
- 605 Blackwater Ridge
- 615 Blackwater Ridge Unit 4247
- 615 Blackwater Ridge
- 611 Blackwater Ridge Unit 4H
- 509 Highwater Pass
- 507 Highwater Pass Unit 4H
- 511 Highwater Pass
- 502 Highwater Pass
- 505 Highwater Pass
- 503 Highwater Pass
- 623 Blackwater Ridge
- 4130 Gold Mill Ridge
- 602 Blackwater Ridge Unit 4H
- 500 Highwater Pass
- 4128 Gold Mill Ridge Unit 4B
- 604 Blackwater Ridge Unit 4H