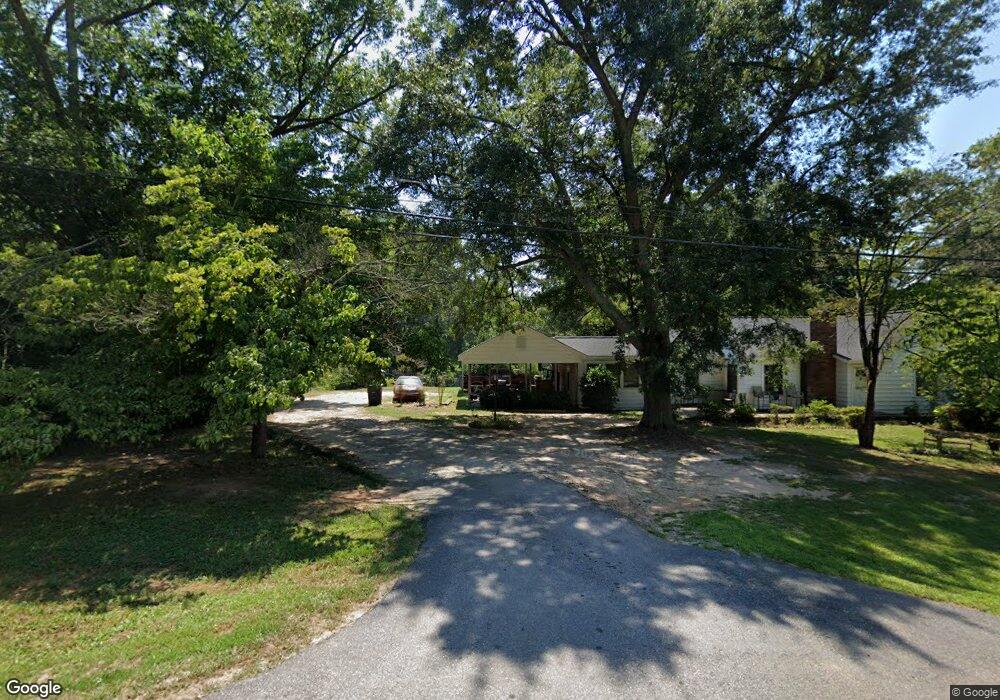
508 Highway 29 Bypass N Anderson, SC 29621
Estimated Value: $199,716 - $294,000
3
Beds
--
Bath
2,357
Sq Ft
$99/Sq Ft
Est. Value
About This Home
This home is located at 508 Highway 29 Bypass N, Anderson, SC 29621 and is currently estimated at $233,679, approximately $99 per square foot. 508 Highway 29 Bypass N is a home located in Anderson County with nearby schools including Nevitt Forest Elementary School, Glenview Middle School, and T.L. Hanna High School.
Ownership History
Date
Name
Owned For
Owner Type
Purchase Details
Closed on
Dec 6, 2023
Sold by
Unknown
Bought by
Wingard Jefferson Christopher
Current Estimated Value
Purchase Details
Closed on
Aug 28, 2013
Sold by
Wingard Jefferson Christopher
Bought by
Wingard Jefferson Clingmon
Home Financials for this Owner
Home Financials are based on the most recent Mortgage that was taken out on this home.
Original Mortgage
$104,703
Interest Rate
4.37%
Mortgage Type
VA
Purchase Details
Closed on
Feb 14, 2011
Sold by
Fountain Carolyn
Bought by
Wingard Jefferson Christopher
Home Financials for this Owner
Home Financials are based on the most recent Mortgage that was taken out on this home.
Original Mortgage
$33,600
Interest Rate
4.76%
Mortgage Type
New Conventional
Purchase Details
Closed on
Oct 20, 2005
Sold by
Fannie Mae
Bought by
Bass Claire
Create a Home Valuation Report for This Property
The Home Valuation Report is an in-depth analysis detailing your home's value as well as a comparison with similar homes in the area
Home Values in the Area
Average Home Value in this Area
Purchase History
| Date | Buyer | Sale Price | Title Company |
|---|---|---|---|
| Wingard Jefferson Christopher | -- | None Listed On Document | |
| Wingard Jefferson Clingmon | $102,500 | -- | |
| Wingard Jefferson Christopher | $42,000 | -- | |
| Bass Claire | -- | Hanover Title Agency |
Source: Public Records
Mortgage History
| Date | Status | Borrower | Loan Amount |
|---|---|---|---|
| Previous Owner | Wingard Jefferson Clingmon | $104,703 | |
| Previous Owner | Wingard Jefferson Christopher | $33,600 |
Source: Public Records
Tax History Compared to Growth
Tax History
| Year | Tax Paid | Tax Assessment Tax Assessment Total Assessment is a certain percentage of the fair market value that is determined by local assessors to be the total taxable value of land and additions on the property. | Land | Improvement |
|---|---|---|---|---|
| 2024 | $3,050 | $7,280 | $910 | $6,370 |
| 2023 | $3,057 | $7,280 | $910 | $6,370 |
| 2022 | $1,066 | $4,850 | $600 | $4,250 |
| 2021 | $535 | $4,250 | $400 | $3,850 |
| 2020 | $535 | $4,250 | $400 | $3,850 |
| 2019 | $535 | $4,250 | $400 | $3,850 |
| 2018 | $539 | $4,250 | $400 | $3,850 |
| 2017 | -- | $4,250 | $400 | $3,850 |
| 2016 | $504 | $4,070 | $400 | $3,670 |
| 2015 | $510 | $6,100 | $600 | $5,500 |
| 2014 | $2,611 | $1,650 | $400 | $1,250 |
Source: Public Records
Map
Nearby Homes
- 606 Highway 29 Bypass N
- 2703 Leftwich Ln
- 0 Highway 29 N Unit 20292906
- 0 Highway 29 N Unit 22331557
- 0 Highway 29 N Unit 22331558
- 0 Highway 29 N Unit 22331556
- 1300 Belhaven Rd
- 304 Fleming Dr
- 3105 U S 29 Unit Lot 16 - 11 Wood For
- 1001 Cox Ave
- 2510 Fleming Dr
- 2211 E River St
- East West E West Parkway Hobson Rd
- 2520 Fleming Dr
- 905 Bolt Dr
- 701 Shamrock Ln
- 1005 Pinecroft Dr
- 217 Islay Way
- 103 Lowland Dr
- 105 Lowland Dr
- 506 Highway 29 Bypass N
- 510 Highway 29 Bypass N
- 2009 Shirlane Dr
- 512 Highway 29 Bypass N
- 504 Highway 29 Bypass N
- 2007 Shirlane Dr
- 518 Highway 29 Bypass N
- 2005 Shirlane Dr
- 502 Highway 29 Bypass N
- 513 Highway 29 Bypass N
- 2003 Shirlane Dr
- 2006 Shirlane Dr
- 503 Highway 29 Bypass N
- 2001 Shirlane Dr
- 2008 Shirlane Dr
- 519 Highway 29 Bypass N
- 520 Highway 29 Bypass N
- 2004 Shirlane Dr
- 521 Highway 29 Bypass N
- 413 Highway 29 Bypass N