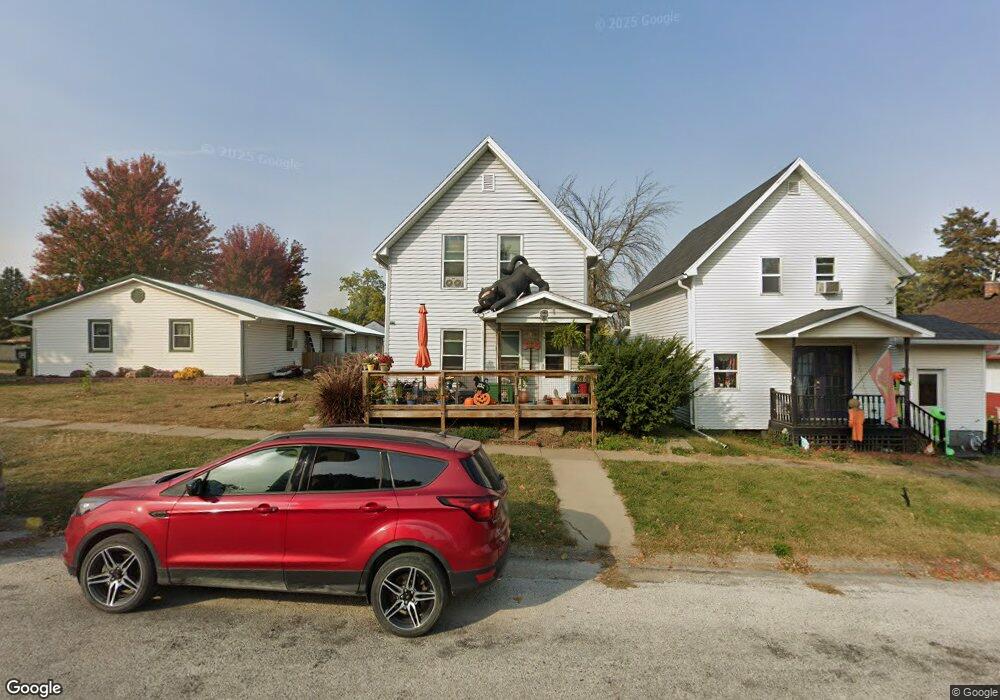
508 Main St Fontanelle, IA 50846
Estimated Value: $56,171 - $79,000
3
Beds
1
Bath
878
Sq Ft
$77/Sq Ft
Est. Value
About This Home
This home is located at 508 Main St, Fontanelle, IA 50846 and is currently estimated at $67,390, approximately $76 per square foot. 508 Main St is a home with nearby schools including Nodaway Valley Elementary School, Nodaway Valley Middle School, and Nodaway Valley High School.
Ownership History
Date
Name
Owned For
Owner Type
Purchase Details
Closed on
Dec 26, 2007
Sold by
Brown Steven A
Bought by
Reddington Jane C and Reddington Brown Jane C
Current Estimated Value
Purchase Details
Closed on
Jun 26, 2007
Sold by
The Estate Of Belva Jean Marckmann
Bought by
Reddington Brown Jane C
Home Financials for this Owner
Home Financials are based on the most recent Mortgage that was taken out on this home.
Original Mortgage
$25,000
Interest Rate
6.49%
Mortgage Type
New Conventional
Create a Home Valuation Report for This Property
The Home Valuation Report is an in-depth analysis detailing your home's value as well as a comparison with similar homes in the area
Home Values in the Area
Average Home Value in this Area
Purchase History
| Date | Buyer | Sale Price | Title Company |
|---|---|---|---|
| Reddington Jane C | -- | None Available | |
| Reddington Brown Jane C | $25,000 | None Available |
Source: Public Records
Mortgage History
| Date | Status | Borrower | Loan Amount |
|---|---|---|---|
| Previous Owner | Reddington Brown Jane C | $25,000 |
Source: Public Records
Tax History Compared to Growth
Tax History
| Year | Tax Paid | Tax Assessment Tax Assessment Total Assessment is a certain percentage of the fair market value that is determined by local assessors to be the total taxable value of land and additions on the property. | Land | Improvement |
|---|---|---|---|---|
| 2024 | $450 | $36,340 | $5,780 | $30,560 |
| 2023 | $524 | $36,340 | $5,780 | $30,560 |
| 2022 | $486 | $33,530 | $4,950 | $28,580 |
| 2021 | $486 | $33,530 | $4,950 | $28,580 |
| 2020 | $418 | $29,040 | $4,950 | $24,090 |
| 2019 | $412 | $29,040 | $0 | $0 |
| 2018 | $396 | $28,261 | $0 | $0 |
| 2017 | $396 | $25,548 | $0 | $0 |
| 2016 | $338 | $25,548 | $2,718 | $22,830 |
| 2015 | $338 | $25,209 | $0 | $0 |
| 2014 | $338 | $25,209 | $0 | $0 |
Source: Public Records
Map
Nearby Homes
- 521 Scott St
- 722 Washington St
- 513 Jefferson St
- 105 W Benton St
- 111 Summerset St
- 905 3rd St Unit 1
- 309 S 1st St
- 407 NW Hayes St
- 308 NW Hayes St
- 203 NW 3rd St
- 425 S 1st St
- 106 SE Oak St
- 107 NE 3rd St
- 304 NE Hayes St
- 309 SE 4th St
- 2548 Iowa 92
- 1978 290th St
- 206 NW Walnut St
- 206 and 212 NW Walnut St
- 209 NW 3rd St