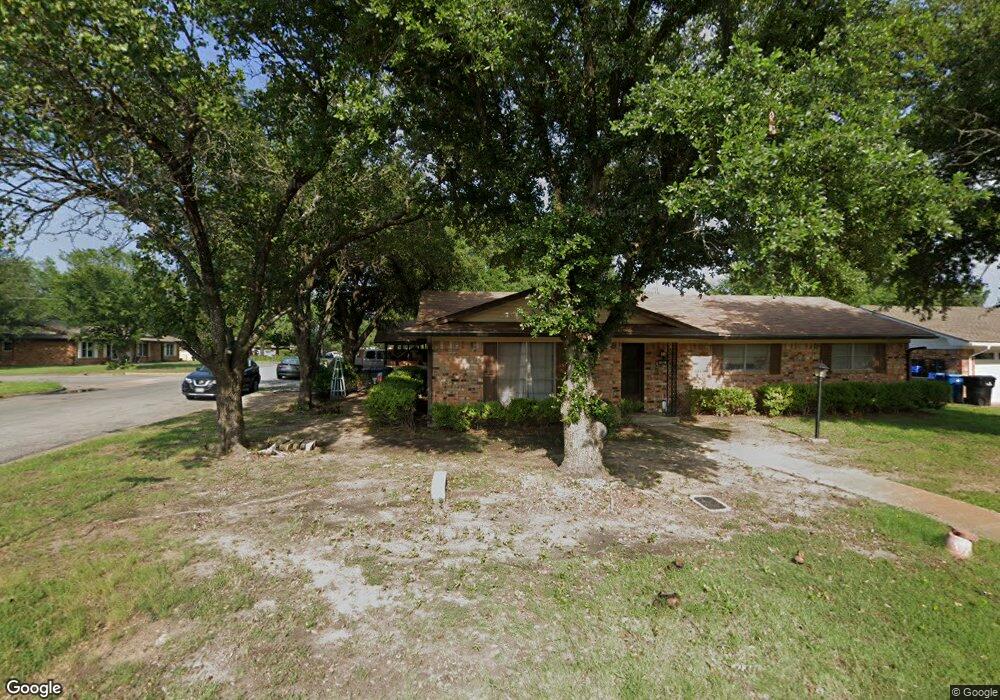
508 Marcel Dr Denison, TX 75020
Estimated Value: $236,800 - $257,000
3
Beds
2
Baths
1,805
Sq Ft
$137/Sq Ft
Est. Value
About This Home
This home is located at 508 Marcel Dr, Denison, TX 75020 and is currently estimated at $246,900, approximately $136 per square foot. 508 Marcel Dr is a home located in Grayson County with nearby schools including Mayes Elementary School, Scott Middle School, and Denison High School.
Ownership History
Date
Name
Owned For
Owner Type
Purchase Details
Closed on
Jun 12, 2025
Sold by
Doherty Darin
Bought by
Darin Doherty Homestead Trust and Wilson
Current Estimated Value
Purchase Details
Closed on
Oct 13, 2015
Sold by
Bfd Holdings Llc
Bought by
Haar Sherry
Home Financials for this Owner
Home Financials are based on the most recent Mortgage that was taken out on this home.
Original Mortgage
$101,750
Interest Rate
3.93%
Mortgage Type
FHA
Purchase Details
Closed on
Jun 29, 2015
Sold by
Ellis Rebecca Lynn and Ellis Rebecca Yerion
Bought by
Bfd Holdings Llc
Home Financials for this Owner
Home Financials are based on the most recent Mortgage that was taken out on this home.
Original Mortgage
$70,000
Interest Rate
3.91%
Mortgage Type
New Conventional
Create a Home Valuation Report for This Property
The Home Valuation Report is an in-depth analysis detailing your home's value as well as a comparison with similar homes in the area
Home Values in the Area
Average Home Value in this Area
Purchase History
| Date | Buyer | Sale Price | Title Company |
|---|---|---|---|
| Darin Doherty Homestead Trust | -- | None Listed On Document | |
| Haar Sherry | -- | Grayson County Title | |
| Bfd Holdings Llc | -- | Grayson County Title |
Source: Public Records
Mortgage History
| Date | Status | Borrower | Loan Amount |
|---|---|---|---|
| Previous Owner | Haar Sherry | $101,750 | |
| Previous Owner | Bfd Holdings Llc | $70,000 |
Source: Public Records
Tax History Compared to Growth
Tax History
| Year | Tax Paid | Tax Assessment Tax Assessment Total Assessment is a certain percentage of the fair market value that is determined by local assessors to be the total taxable value of land and additions on the property. | Land | Improvement |
|---|---|---|---|---|
| 2025 | $1,417 | $239,901 | $54,556 | $185,345 |
| 2024 | $4,884 | $210,202 | $0 | $0 |
| 2023 | $1,418 | $191,093 | $0 | $0 |
| 2022 | $4,127 | $173,721 | $0 | $0 |
| 2021 | $3,983 | $157,928 | $31,926 | $126,002 |
| 2020 | $3,845 | $157,043 | $18,404 | $138,639 |
| 2019 | $3,646 | $132,500 | $15,306 | $117,194 |
| 2018 | $3,676 | $132,500 | $15,306 | $117,194 |
| 2017 | $3,003 | $107,345 | $13,616 | $93,729 |
| 2016 | $2,805 | $100,252 | $13,052 | $87,200 |
| 2015 | $2,387 | $84,491 | $8,827 | $75,664 |
| 2014 | $2,387 | $84,491 | $8,827 | $75,664 |
Source: Public Records
Map
Nearby Homes
- 509 Bryan Dr
- Flora ,TBD Flora Ln
- 2107 Rivercrest Cir
- 2603 Brookhaven Dr
- The Colorado Plan at Miller Street Cottages
- The Welsh Plan at Miller Street Cottages
- The Dales Plan at Miller Street Cottages
- The Kentucky Plan at Miller Street Cottages
- Exmoor Plan at Miller Street Cottages
- The Carolina Plan at Miller Street Cottages
- 2408 Miller St
- TBD W Crawford St
- 2521 Brookhaven Dr
- 2105 W Crawford St
- 2404 Miller St
- 2385 Miller St
- 2396 Miller St
- 2380 Miller St
- 2389 Miller St
- 2413 Miller St