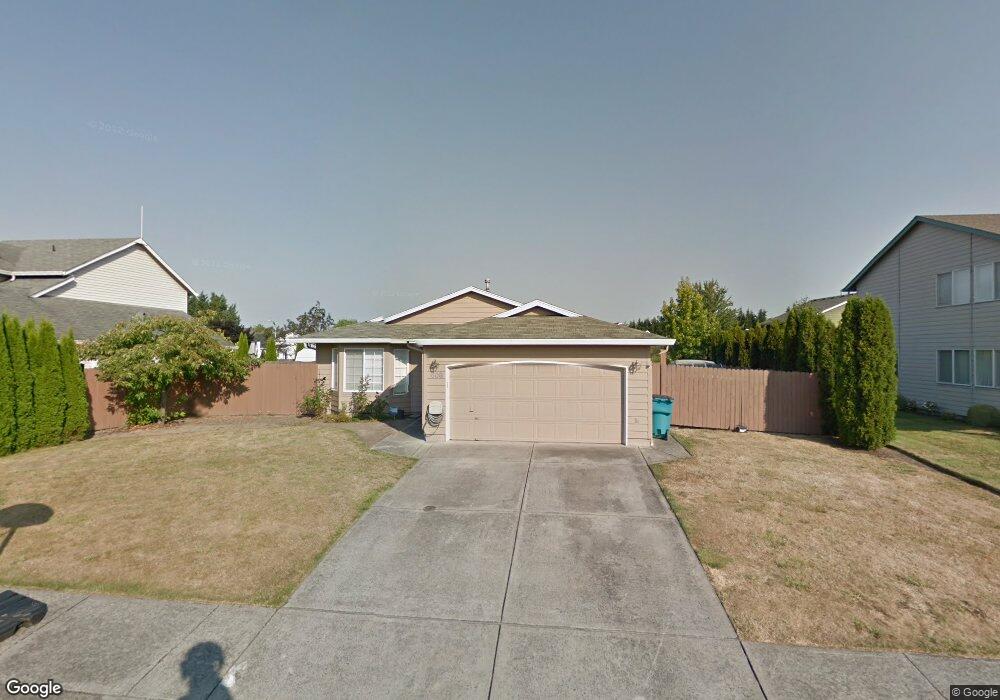
508 NE 136th Way Vancouver, WA 98685
Knapp NeighborhoodEstimated Value: $505,000 - $560,000
3
Beds
2
Baths
1,583
Sq Ft
$332/Sq Ft
Est. Value
About This Home
This home is located at 508 NE 136th Way, Vancouver, WA 98685 and is currently estimated at $526,213, approximately $332 per square foot. 508 NE 136th Way is a home located in Clark County with nearby schools including Chinook Elementary School, Alki Middle School, and Skyview High School.
Ownership History
Date
Name
Owned For
Owner Type
Purchase Details
Closed on
Mar 12, 2002
Sold by
Heup Bambi L and Croft Michelle L
Bought by
Puebla Ramos Guillermo and Puebla Ramos Melissa
Current Estimated Value
Home Financials for this Owner
Home Financials are based on the most recent Mortgage that was taken out on this home.
Original Mortgage
$158,512
Outstanding Balance
$65,888
Interest Rate
6.99%
Mortgage Type
FHA
Estimated Equity
$460,325
Purchase Details
Closed on
Apr 24, 1998
Sold by
Schmidt Troy P and Tamimi Schmidt Farahnaz
Bought by
Heup Bambi L and Croft Michelle L
Home Financials for this Owner
Home Financials are based on the most recent Mortgage that was taken out on this home.
Original Mortgage
$144,850
Interest Rate
7.15%
Purchase Details
Closed on
Dec 28, 1994
Sold by
Nuwest Builders Inc and Schmidt Troy P
Bought by
Schmidt Troy P and Tamimi Schmidt Farahnaz
Home Financials for this Owner
Home Financials are based on the most recent Mortgage that was taken out on this home.
Original Mortgage
$123,500
Interest Rate
9.03%
Create a Home Valuation Report for This Property
The Home Valuation Report is an in-depth analysis detailing your home's value as well as a comparison with similar homes in the area
Home Values in the Area
Average Home Value in this Area
Purchase History
| Date | Buyer | Sale Price | Title Company |
|---|---|---|---|
| Puebla Ramos Guillermo | $162,861 | Chicago Title Insurance | |
| Heup Bambi L | $124,426 | Charter Title Corporation | |
| Schmidt Troy P | -- | Chicago Title Insurance Co | |
| Nuwest Builders Inc | $36,750 | Stewart Title Company |
Source: Public Records
Mortgage History
| Date | Status | Borrower | Loan Amount |
|---|---|---|---|
| Open | Puebla Ramos Guillermo | $158,512 | |
| Previous Owner | Heup Bambi L | $144,850 | |
| Previous Owner | Schmidt Troy P | $123,500 |
Source: Public Records
Tax History Compared to Growth
Tax History
| Year | Tax Paid | Tax Assessment Tax Assessment Total Assessment is a certain percentage of the fair market value that is determined by local assessors to be the total taxable value of land and additions on the property. | Land | Improvement |
|---|---|---|---|---|
| 2025 | $4,996 | $513,795 | $211,600 | $302,195 |
| 2024 | $4,742 | $472,444 | $211,600 | $260,844 |
| 2023 | $4,578 | $505,317 | $218,500 | $286,817 |
| 2022 | $4,358 | $464,458 | $218,500 | $245,958 |
| 2021 | $4,223 | $393,857 | $157,500 | $236,357 |
| 2020 | $3,826 | $358,150 | $144,000 | $214,150 |
| 2019 | $3,606 | $344,554 | $144,000 | $200,554 |
| 2018 | $3,778 | $337,056 | $0 | $0 |
| 2017 | $3,350 | $294,410 | $0 | $0 |
| 2016 | $3,232 | $271,676 | $0 | $0 |
| 2015 | $3,141 | $245,032 | $0 | $0 |
| 2014 | -- | $229,853 | $0 | $0 |
| 2013 | -- | $207,633 | $0 | $0 |
Source: Public Records
Map
Nearby Homes
- 13419 NE 6th Ct
- 911 NE Tenney Rd
- 14204 NE 10th Ave
- 306 NW 134th St
- 1207 NE Knowles Dr
- 508 NE 127th St
- 1312 NE 131st Cir
- 14411 NE 8th Ct
- 14217 NE 10th Ave
- 1317 NE 143rd St
- 1305 NE Knowles Dr
- 12704 NE 11th Place
- 13846 NW 10th Ct
- 304 NE 148th St
- 13114 NW 8th Way Unit B
- 13821 NW 10th Ct Unit H
- 13821 NW 10th Ct Unit G
- 13813 NW 10th Ct Unit C
- 207 NW 150th Way
- 215 NW 150th Way
- 418 NE 136th Way
- 514 NE 136th Way
- 514 NE 136th Way
- 13611 NE 4th Ct
- 13616 NE 6th Ave
- 509 NE 136th Way
- 503 NE 136th Way
- 13702 NE 6th Ct
- 13615 NE 4th Ct
- 515 NE 136th Way
- 417 NE 136th Way
- 412 NE 136th Way
- 13706 NE 6th Ct
- 411 NE 136th Way
- 13606 NE 6th Ave
- 13615 NE 6th Ct
- 13619 NE 4th Ct
- 13615 NE 6th Ave
- 13517 NE 5th Ct
- 13611 NE 6th Ave