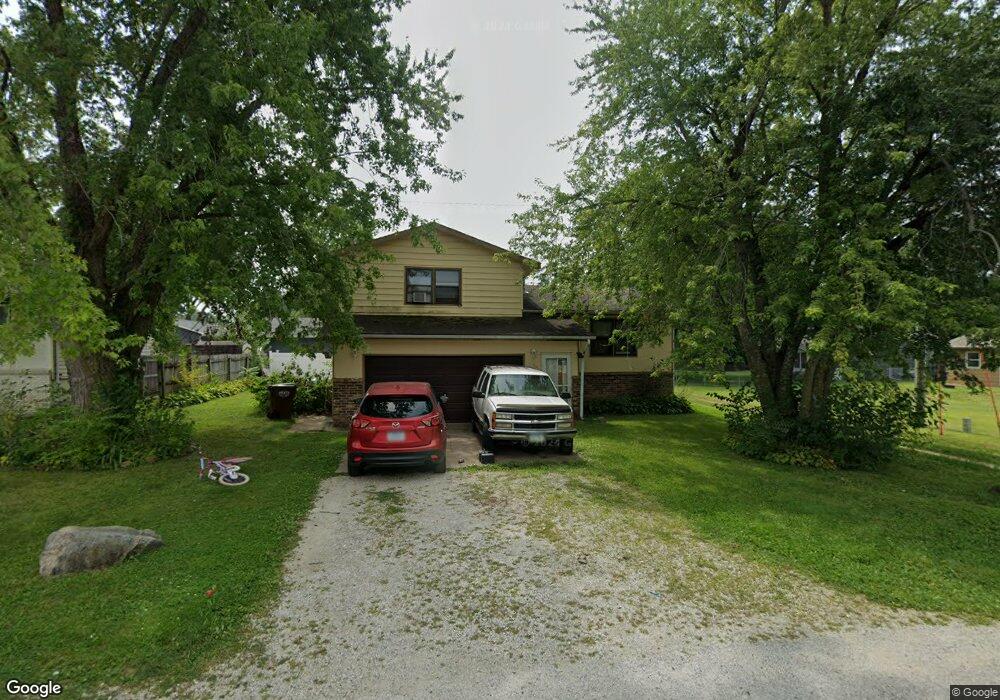
508 North St Maxwell, IA 50161
Estimated Value: $172,000 - $198,000
3
Beds
1
Bath
1,040
Sq Ft
$181/Sq Ft
Est. Value
About This Home
This home is located at 508 North St, Maxwell, IA 50161 and is currently estimated at $188,562, approximately $181 per square foot. 508 North St is a home located in Story County with nearby schools including Collins-Maxwell Elementary School and Collins-Maxwell Middle/High School.
Ownership History
Date
Name
Owned For
Owner Type
Purchase Details
Closed on
Jun 22, 2018
Sold by
Dunlay Joseph J and Dunlay Jillian
Bought by
Rossow Gregory and Rossow Danielle
Current Estimated Value
Home Financials for this Owner
Home Financials are based on the most recent Mortgage that was taken out on this home.
Original Mortgage
$121,212
Outstanding Balance
$104,828
Interest Rate
4.5%
Mortgage Type
Unknown
Estimated Equity
$83,734
Purchase Details
Closed on
Oct 14, 2011
Sold by
Britton Benjamin L and Blattel Britton Carolyn M
Bought by
Blattel Britton John Michael and Blattel Britton Carl Benjamin
Create a Home Valuation Report for This Property
The Home Valuation Report is an in-depth analysis detailing your home's value as well as a comparison with similar homes in the area
Home Values in the Area
Average Home Value in this Area
Purchase History
| Date | Buyer | Sale Price | Title Company |
|---|---|---|---|
| Rossow Gregory | $120,000 | -- | |
| Blattel Britton John Michael | -- | -- |
Source: Public Records
Mortgage History
| Date | Status | Borrower | Loan Amount |
|---|---|---|---|
| Open | Rossow Gregory | $121,212 |
Source: Public Records
Tax History Compared to Growth
Tax History
| Year | Tax Paid | Tax Assessment Tax Assessment Total Assessment is a certain percentage of the fair market value that is determined by local assessors to be the total taxable value of land and additions on the property. | Land | Improvement |
|---|---|---|---|---|
| 2025 | $2,734 | $167,000 | $19,400 | $147,600 |
| 2024 | $2,692 | $159,500 | $18,100 | $141,400 |
| 2023 | $2,678 | $159,500 | $18,100 | $141,400 |
| 2022 | $2,720 | $134,700 | $18,100 | $116,600 |
| 2021 | $2,754 | $134,700 | $18,100 | $116,600 |
| 2020 | $2,454 | $129,100 | $9,600 | $119,500 |
| 2019 | $2,454 | $129,100 | $9,600 | $119,500 |
| 2018 | $2,046 | $124,100 | $9,600 | $114,500 |
| 2017 | $2,046 | $124,100 | $9,600 | $114,500 |
| 2016 | $1,860 | $109,200 | $7,800 | $101,400 |
| 2015 | $1,860 | $109,200 | $7,800 | $101,400 |
| 2014 | $1,748 | $105,700 | $8,300 | $97,400 |
Source: Public Records
Map
Nearby Homes