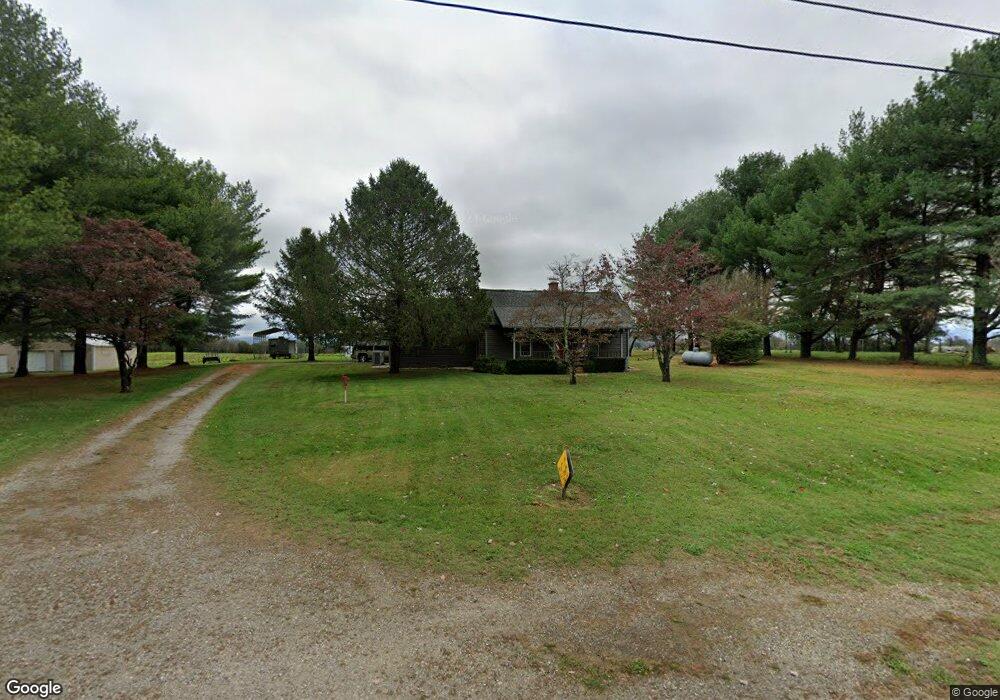
508 Rutledge Ford Rd Decherd, TN 37324
Estimated Value: $143,000 - $180,000
2
Beds
2
Baths
1,174
Sq Ft
$142/Sq Ft
Est. Value
About This Home
This home is located at 508 Rutledge Ford Rd, Decherd, TN 37324 and is currently estimated at $166,266, approximately $141 per square foot. 508 Rutledge Ford Rd is a home located in Franklin County with nearby schools including North Middle School and Franklin County High School.
Ownership History
Date
Name
Owned For
Owner Type
Purchase Details
Closed on
Mar 18, 2019
Sold by
Christian Donald G and Christian Kathy C
Bought by
Christian Donald G and Christian Kathy C
Current Estimated Value
Purchase Details
Closed on
Oct 7, 2016
Sold by
Buckner Michael Thomas
Bought by
Christian Donald G and Christian Kathy C
Home Financials for this Owner
Home Financials are based on the most recent Mortgage that was taken out on this home.
Original Mortgage
$54,000
Outstanding Balance
$43,030
Interest Rate
3.44%
Mortgage Type
New Conventional
Estimated Equity
$123,236
Purchase Details
Closed on
Aug 7, 2008
Sold by
Hill Barbara Ann Rose
Bought by
Buckner Michael Thomas
Purchase Details
Closed on
Nov 19, 1990
Bought by
Rose Ronnie Carson and Barbara Ann
Purchase Details
Closed on
Aug 20, 1988
Bought by
Rose Carson D and Rose Gladys
Purchase Details
Closed on
Oct 3, 1969
Bought by
Strecker Sue
Purchase Details
Closed on
Jun 15, 1948
Create a Home Valuation Report for This Property
The Home Valuation Report is an in-depth analysis detailing your home's value as well as a comparison with similar homes in the area
Purchase History
| Date | Buyer | Sale Price | Title Company |
|---|---|---|---|
| Christian Donald G | -- | Southern Tennessee T&E Llc | |
| Christian Donald G | $60,000 | -- | |
| Buckner Michael Thomas | $57,000 | -- | |
| Rose Ronnie Carson | $18,000 | -- | |
| Rose Carson D | $18,000 | -- | |
| Strecker Sue | -- | -- | |
| -- | -- | -- |
Source: Public Records
Mortgage History
| Date | Status | Borrower | Loan Amount |
|---|---|---|---|
| Open | Christian Donald G | $54,000 |
Source: Public Records
Tax History
| Year | Tax Paid | Tax Assessment Tax Assessment Total Assessment is a certain percentage of the fair market value that is determined by local assessors to be the total taxable value of land and additions on the property. | Land | Improvement |
|---|---|---|---|---|
| 2025 | $483 | $24,200 | $4,425 | $19,775 |
| 2024 | $483 | $24,200 | $4,425 | $19,775 |
| 2023 | $483 | $24,200 | $4,425 | $19,775 |
| 2022 | $439 | $23,425 | $4,425 | $19,000 |
| 2021 | $458 | $23,425 | $4,425 | $19,000 |
| 2020 | $458 | $15,900 | $3,900 | $12,000 |
| 2019 | $393 | $13,650 | $3,900 | $9,750 |
| 2018 | $365 | $13,650 | $3,900 | $9,750 |
| 2017 | $344 | $12,850 | $3,900 | $8,950 |
| 2016 | $289 | $10,825 | $2,850 | $7,975 |
| 2015 | $289 | $10,825 | $2,850 | $7,975 |
| 2014 | $290 | $10,842 | $0 | $0 |
Source: Public Records
Map
Nearby Homes
- 10028 Old Alto Hwy
- 431 Rose Dr
- 0 Old Alto Hwy Unit RTC3039048
- 460 Walls Ln
- 774 Sherrell Rd
- 8084 Old Alto Hwy
- 640 Dotson Cemetery Rd
- 1645 Oak Grove Rd
- 7806 Old Alto Hwy
- 0 Dotson Cemetery Rd
- 2575 Spur Rd
- 106 Wilder Chapel Rd
- 3310 Oak Grove Rd
- 3336 Oak Grove Rd
- 836 Spur Rd
- 0 Spur Rd Unit RTC3013780
- 0 Spur Rd Unit RTC3013804
- 0 Spur Rd Unit RTC3013799
- 0 Spur Rd Unit RTC2991940
- 0 Spur Rd Unit RTC3130647
- 546 Rutledge Ford Rd
- 466 Rutledge Ford Rd
- 620 Rutledge Ford Rd
- 646 Rutledge Ford Rd
- 722 Rutledge Ford Rd
- 284 Rutledge Ford Rd
- 10970 David Crockett Pkwy E
- 777 Rutledge Ford Rd
- 201 Buckner Farm Ln
- 9847 Old Alto Hwy
- 9993 Old Alto Hwy
- 10045 Old Alto Hwy
- 60 Rutledge Ford Rd
- 69 Rutledge Ford Rd
- 9815 Old Alto Hwy
- 45 Rutledge Ford Rd
- 9890 Old Alto Hwy
- 1014 Rutledge Ford Rd
- 9711 Old Alto Hwy
- 9697 Old Alto Hwy
Your Personal Tour Guide
Ask me questions while you tour the home.