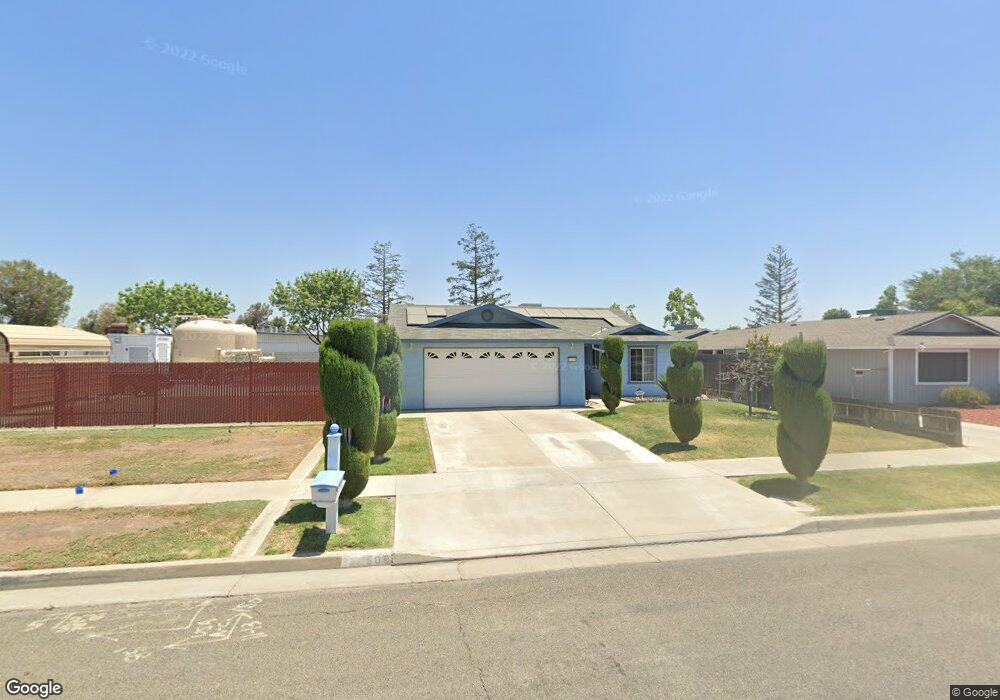
508 S U St Tulare, CA 93274
Tulare Southeast NeighborhoodEstimated Value: $286,000 - $318,763
4
Beds
2
Baths
1,350
Sq Ft
$225/Sq Ft
Est. Value
About This Home
This home is located at 508 S U St, Tulare, CA 93274 and is currently estimated at $304,191, approximately $225 per square foot. 508 S U St is a home located in Tulare County with nearby schools including Lincoln Elementary School, Cherry Avenue Middle School, and Tulare Union High School.
Ownership History
Date
Name
Owned For
Owner Type
Purchase Details
Closed on
May 12, 2010
Sold by
Gomez Irma Suarez
Bought by
Mercado Irma Suarez
Current Estimated Value
Purchase Details
Closed on
May 18, 2001
Sold by
Chavez Antonio Gomez
Bought by
Suarez Gomez Irma
Purchase Details
Closed on
Feb 23, 2001
Sold by
Gomez Irma Suarez
Bought by
Chavez Antonio Gomez and Gomez Irma Suarez
Home Financials for this Owner
Home Financials are based on the most recent Mortgage that was taken out on this home.
Original Mortgage
$93,471
Interest Rate
6.98%
Mortgage Type
FHA
Purchase Details
Closed on
Oct 10, 2000
Sold by
Chavez Antonio Gomez
Bought by
Gomez Irma Suarez
Purchase Details
Closed on
Mar 7, 2000
Sold by
Self Help Enterprises
Bought by
Chavez Antonio Gomez and Mercado Irma Suarez
Home Financials for this Owner
Home Financials are based on the most recent Mortgage that was taken out on this home.
Original Mortgage
$89,862
Interest Rate
8.26%
Mortgage Type
FHA
Create a Home Valuation Report for This Property
The Home Valuation Report is an in-depth analysis detailing your home's value as well as a comparison with similar homes in the area
Home Values in the Area
Average Home Value in this Area
Purchase History
| Date | Buyer | Sale Price | Title Company |
|---|---|---|---|
| Mercado Irma Suarez | -- | None Available | |
| Suarez Gomez Irma | -- | -- | |
| Chavez Antonio Gomez | -- | Fidelity National Title Co | |
| Gomez Irma Suarez | -- | -- | |
| Chavez Antonio Gomez | $90,000 | Chicago Title Co |
Source: Public Records
Mortgage History
| Date | Status | Borrower | Loan Amount |
|---|---|---|---|
| Previous Owner | Chavez Antonio Gomez | $93,471 | |
| Previous Owner | Chavez Antonio Gomez | $89,862 | |
| Closed | Chavez Antonio Gomez | $89,862 |
Source: Public Records
Tax History
| Year | Tax Paid | Tax Assessment Tax Assessment Total Assessment is a certain percentage of the fair market value that is determined by local assessors to be the total taxable value of land and additions on the property. | Land | Improvement |
|---|---|---|---|---|
| 2025 | $1,428 | $138,330 | $27,664 | $110,666 |
| 2024 | $1,428 | $135,619 | $27,122 | $108,497 |
| 2023 | $1,390 | $132,961 | $26,591 | $106,370 |
| 2022 | $1,348 | $130,355 | $26,070 | $104,285 |
| 2021 | $1,329 | $127,799 | $25,559 | $102,240 |
| 2020 | $1,351 | $126,489 | $25,297 | $101,192 |
| 2019 | $1,383 | $124,009 | $24,801 | $99,208 |
| 2018 | $1,359 | $121,578 | $24,315 | $97,263 |
| 2017 | $1,345 | $119,194 | $23,838 | $95,356 |
| 2016 | $1,284 | $116,857 | $23,371 | $93,486 |
| 2015 | $1,239 | $115,102 | $23,020 | $92,082 |
| 2014 | $1,239 | $112,847 | $22,569 | $90,278 |
Source: Public Records
Map
Nearby Homes
- 610 S U St
- 0 Spruce St S Unit 239148
- 0 Spruce St S Unit 233400
- 1453 E Sonora Ave
- 149 S Salida Place
- 456 S Becky St
- 1 Spruce St
- 501 S Magnolia St
- 620 Mariposa Ave
- 980 S Spruce St
- 840 E Bardsley Ave
- 421 S Laspina St
- 861 E Sycamore Ave
- 815 E Sycamore Ave
- 1533 Etna Dr
- 1483 E Bardsley Ave
- 1544 E Bardsley Ave
- 320 N Blackstone St Unit 14
- 1214 S Spruce St
- 1316 S Spruce St
Your Personal Tour Guide
Ask me questions while you tour the home.