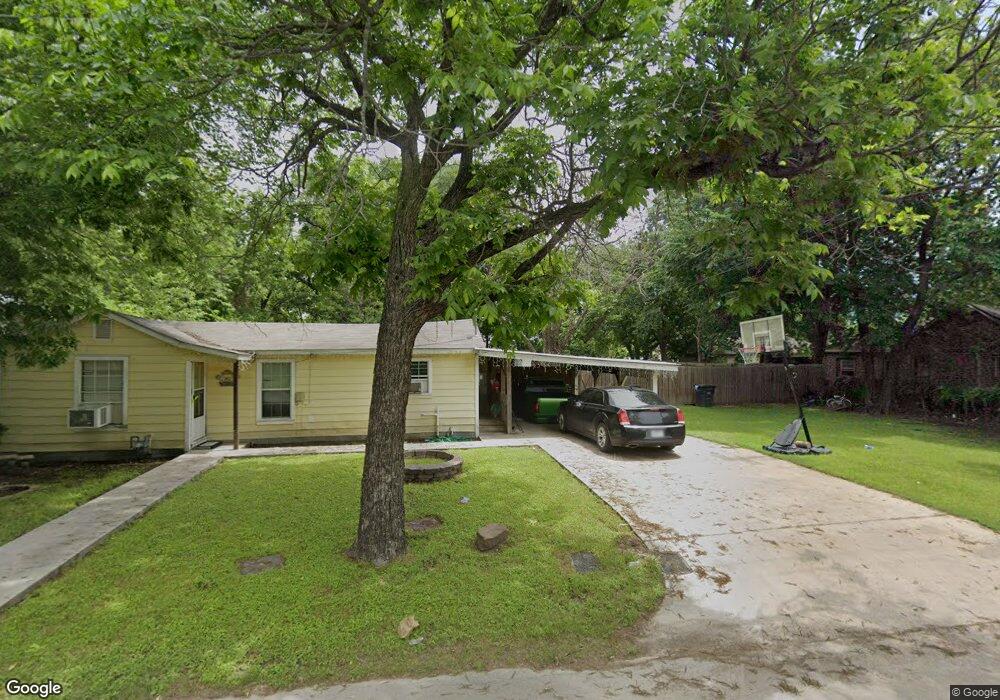
508 Sabine Ave Cleburne, TX 76031
Estimated Value: $160,000 - $224,000
3
Beds
1
Bath
1,152
Sq Ft
$162/Sq Ft
Est. Value
About This Home
This home is located at 508 Sabine Ave, Cleburne, TX 76031 and is currently estimated at $186,291, approximately $161 per square foot. 508 Sabine Ave is a home located in Johnson County with nearby schools including Santa Fe Elementary School, Lowell Smith Jr. Middle School, and Cleburne High School.
Ownership History
Date
Name
Owned For
Owner Type
Purchase Details
Closed on
Mar 12, 2018
Sold by
Barnes John Christopher
Bought by
Castanuela Genie Z and Ortiz Joel G
Current Estimated Value
Home Financials for this Owner
Home Financials are based on the most recent Mortgage that was taken out on this home.
Original Mortgage
$40,000
Outstanding Balance
$34,088
Interest Rate
4.15%
Mortgage Type
New Conventional
Estimated Equity
$152,203
Purchase Details
Closed on
Apr 4, 2017
Sold by
Tramell Melissa Sue
Bought by
Barmnes John Chrfistopher
Purchase Details
Closed on
Apr 3, 2017
Sold by
Daniel Travis Lynn
Bought by
Trammell Melissa Sue
Purchase Details
Closed on
Mar 24, 2017
Sold by
Daniel Brenda
Bought by
Daniel Travis Lynn
Purchase Details
Closed on
Mar 11, 2015
Sold by
Daniel Brenda
Bought by
Daniel Travis L
Create a Home Valuation Report for This Property
The Home Valuation Report is an in-depth analysis detailing your home's value as well as a comparison with similar homes in the area
Home Values in the Area
Average Home Value in this Area
Purchase History
| Date | Buyer | Sale Price | Title Company |
|---|---|---|---|
| Castanuela Genie Z | -- | None Available | |
| Barmnes John Chrfistopher | -- | None Available | |
| Trammell Melissa Sue | -- | None Available | |
| Daniel Travis Lynn | -- | None Available | |
| Daniel Travis L | -- | -- |
Source: Public Records
Mortgage History
| Date | Status | Borrower | Loan Amount |
|---|---|---|---|
| Open | Castanuela Genie Z | $40,000 |
Source: Public Records
Tax History Compared to Growth
Tax History
| Year | Tax Paid | Tax Assessment Tax Assessment Total Assessment is a certain percentage of the fair market value that is determined by local assessors to be the total taxable value of land and additions on the property. | Land | Improvement |
|---|---|---|---|---|
| 2025 | $1,007 | $123,549 | $43,000 | $80,549 |
| 2024 | $2,304 | $103,320 | $0 | $0 |
| 2023 | $874 | $104,049 | $23,500 | $80,549 |
| 2022 | $2,137 | $104,049 | $23,500 | $80,549 |
| 2021 | $2,025 | $104,049 | $23,500 | $80,549 |
| 2020 | $1,955 | $70,568 | $20,000 | $50,568 |
| 2019 | $2,085 | $70,568 | $20,000 | $50,568 |
| 2018 | $1,382 | $46,743 | $10,500 | $36,243 |
| 2017 | $1,376 | $46,743 | $10,500 | $36,243 |
| 2016 | $1,376 | $46,743 | $10,500 | $36,243 |
| 2015 | $186 | $46,743 | $10,500 | $36,243 |
| 2014 | $186 | $46,743 | $10,500 | $36,243 |
Source: Public Records
Map
Nearby Homes
- 438 Sabine Ave
- 1014 Trinity St
- 1300 N Brazos Ave
- 1308 N Brazos Ave
- 1609 N Brazos Ave
- 622 Mansfield Rd
- 806 Barber Ave
- 301 Eastland St
- 604 Crockett Dr
- 612 Crockett Dr
- 616 Crockett Dr
- 1103 Chase Ave
- 621 Crockett Dr
- 204 Robbins St
- 709 N Wilhite St Unit 711
- 605 Olive St
- 741 N Robinson St
- 735 N Robinson St
- 614 N Robinson St
- 1024 Alvarado St