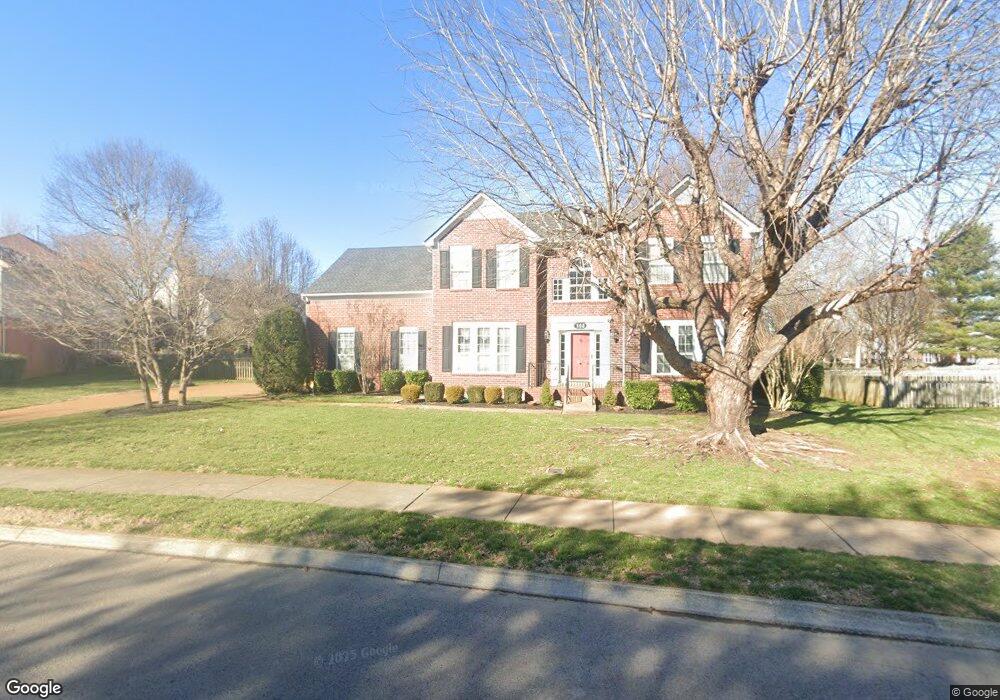
508 Sharpe Dr Franklin, TN 37064
West Franklin NeighborhoodEstimated Value: $735,000 - $795,000
--
Bed
4
Baths
2,608
Sq Ft
$294/Sq Ft
Est. Value
About This Home
This home is located at 508 Sharpe Dr, Franklin, TN 37064 and is currently estimated at $767,867, approximately $294 per square foot. 508 Sharpe Dr is a home located in Williamson County with nearby schools including Poplar Grove K-4, Johnson Elementary School, and Poplar Grove 5-8.
Ownership History
Date
Name
Owned For
Owner Type
Purchase Details
Closed on
Jan 21, 2014
Sold by
Olander James W
Bought by
Olander Marjorie D
Current Estimated Value
Purchase Details
Closed on
Jul 20, 2010
Sold by
Olander William C and Olander Marjorie D
Bought by
Marjorie D Olander Living Trust
Purchase Details
Closed on
Jul 1, 2003
Sold by
Magill Michael E and Magill Deborah
Bought by
Olander William C and Olander Marjorie D
Home Financials for this Owner
Home Financials are based on the most recent Mortgage that was taken out on this home.
Original Mortgage
$176,500
Outstanding Balance
$74,926
Interest Rate
5.24%
Mortgage Type
Purchase Money Mortgage
Estimated Equity
$692,941
Create a Home Valuation Report for This Property
The Home Valuation Report is an in-depth analysis detailing your home's value as well as a comparison with similar homes in the area
Home Values in the Area
Average Home Value in this Area
Purchase History
| Date | Buyer | Sale Price | Title Company |
|---|---|---|---|
| Olander Marjorie D | -- | None Available | |
| Marjorie D Olander Living Trust | -- | None Available | |
| Olander William C | $246,500 | -- |
Source: Public Records
Mortgage History
| Date | Status | Borrower | Loan Amount |
|---|---|---|---|
| Open | Olander William C | $176,500 |
Source: Public Records
Tax History Compared to Growth
Tax History
| Year | Tax Paid | Tax Assessment Tax Assessment Total Assessment is a certain percentage of the fair market value that is determined by local assessors to be the total taxable value of land and additions on the property. | Land | Improvement |
|---|---|---|---|---|
| 2024 | $2,739 | $111,125 | $28,750 | $82,375 |
| 2023 | $2,617 | $111,125 | $28,750 | $82,375 |
| 2022 | $2,617 | $111,125 | $28,750 | $82,375 |
| 2021 | $2,617 | $111,125 | $28,750 | $82,375 |
| 2020 | $2,551 | $86,625 | $22,500 | $64,125 |
| 2019 | $2,551 | $86,625 | $22,500 | $64,125 |
| 2018 | $2,551 | $86,625 | $22,500 | $64,125 |
| 2017 | $2,551 | $86,625 | $22,500 | $64,125 |
| 2016 | $0 | $86,625 | $22,500 | $64,125 |
| 2015 | -- | $73,525 | $15,625 | $57,900 |
| 2014 | -- | $73,525 | $15,625 | $57,900 |
Source: Public Records
Map
Nearby Homes
- 305 Abram Ct
- 310 Devonshire Dr
- 527 Antebellum Ct
- Azalea Plan at Reese
- Jordan Plan at Reese
- 523 Antebellum Ct
- 5029 Owenruth Dr
- 714 Founders Pointe Blvd
- 5037 Owenruth Dr
- 4068 Penfield Dr
- 4064 Penfield Dr
- 4072 Penfield Dr
- 4060 Penfield Dr
- 5041 Owenruth Dr
- 4076 Penfield Dr
- 3042 Blossom Trail Ln
- 215 Wrennewood Ln
- 1632 Cooper Creek Ln
- 454 Cardel Ln
- 226 Wrennewood Ln
- 401 Fontaine Dr
- 303 Abram Ct
- 403 Fontaine Dr
- 301 Abram Ct
- 507 Sharpe Dr
- 509 Sharpe Dr
- 405 Fontaine Dr
- 505 Sharpe Dr
- 306 Abram Ct
- 400 Fontaine Dr
- 607 Rutherford Ln
- 605 Rutherford Ln
- 609 Rutherford Ln
- 306 Founders Pointe Blvd
- 603 Rutherford Ln
- 407 Fontaine Dr
- 304 Founders Pointe Blvd
- 304 Abram Ct
- 201 Harris Ct
- 503 Sharpe Dr