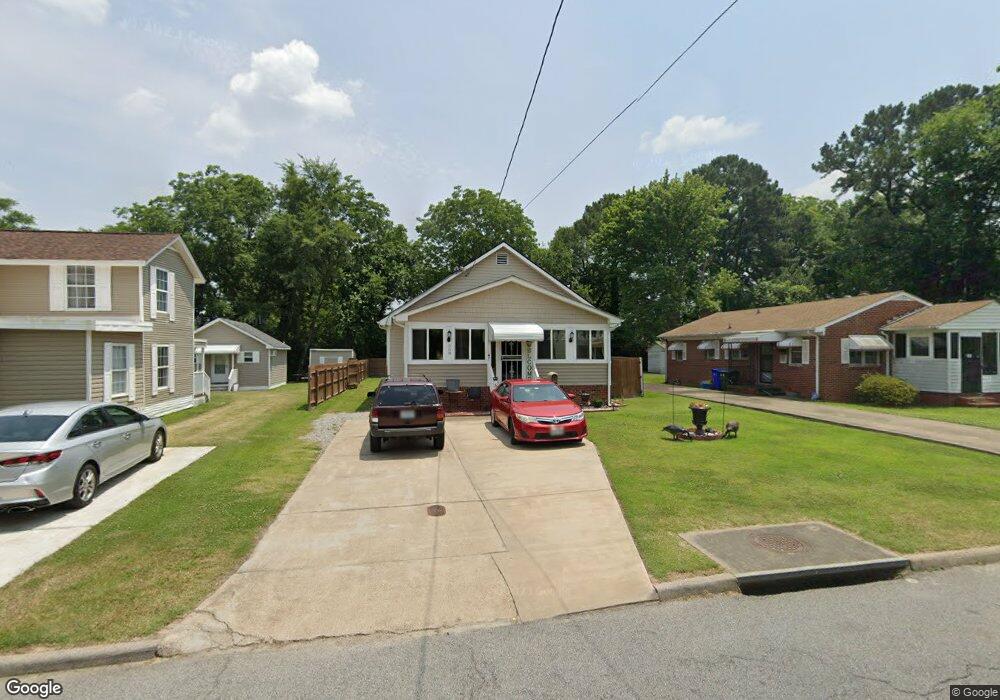
508 Spruce St Suffolk, VA 23434
Holy Neck NeighborhoodEstimated Value: $253,000 - $279,632
3
Beds
2
Baths
1,500
Sq Ft
$178/Sq Ft
Est. Value
About This Home
This home is located at 508 Spruce St, Suffolk, VA 23434 and is currently estimated at $267,158, approximately $178 per square foot. 508 Spruce St is a home located in Suffolk City with nearby schools including Booker T. Washington Elementary School, King's Fork Middle School, and Lakeland High School.
Ownership History
Date
Name
Owned For
Owner Type
Purchase Details
Closed on
Jan 24, 2017
Sold by
Suffolk Redevelopment And Housing Author
Bought by
Moore Walter R and Moore Judith
Current Estimated Value
Home Financials for this Owner
Home Financials are based on the most recent Mortgage that was taken out on this home.
Original Mortgage
$87,837
Outstanding Balance
$72,725
Interest Rate
4.2%
Mortgage Type
New Conventional
Estimated Equity
$194,433
Purchase Details
Closed on
Jul 15, 2014
Sold by
Fannie Mae
Bought by
Suffolk Redevelopment And Hous
Create a Home Valuation Report for This Property
The Home Valuation Report is an in-depth analysis detailing your home's value as well as a comparison with similar homes in the area
Home Values in the Area
Average Home Value in this Area
Purchase History
| Date | Buyer | Sale Price | Title Company |
|---|---|---|---|
| Moore Walter R | $129,020 | Advance Title & Abstract Inc | |
| Suffolk Redevelopment And Hous | $108,900 | -- |
Source: Public Records
Mortgage History
| Date | Status | Borrower | Loan Amount |
|---|---|---|---|
| Open | Moore Walter R | $87,837 |
Source: Public Records
Tax History Compared to Growth
Tax History
| Year | Tax Paid | Tax Assessment Tax Assessment Total Assessment is a certain percentage of the fair market value that is determined by local assessors to be the total taxable value of land and additions on the property. | Land | Improvement |
|---|---|---|---|---|
| 2024 | $450 | $247,100 | $46,100 | $201,000 |
| 2023 | $393 | $240,700 | $43,900 | $196,800 |
| 2022 | $2,320 | $212,800 | $31,300 | $181,500 |
| 2021 | $2,037 | $183,500 | $25,100 | $158,400 |
| 2020 | $1,952 | $175,900 | $22,800 | $153,100 |
| 2019 | $1,835 | $165,300 | $22,800 | $142,500 |
| 2018 | $135 | $164,900 | $22,800 | $142,100 |
| 2017 | $1,651 | $154,300 | $22,800 | $131,500 |
| 2016 | $1,538 | $143,700 | $22,800 | $120,900 |
| 2015 | $859 | $138,500 | $22,800 | $115,700 |
| 2014 | $859 | $138,500 | $22,800 | $115,700 |
Source: Public Records
Map
Nearby Homes