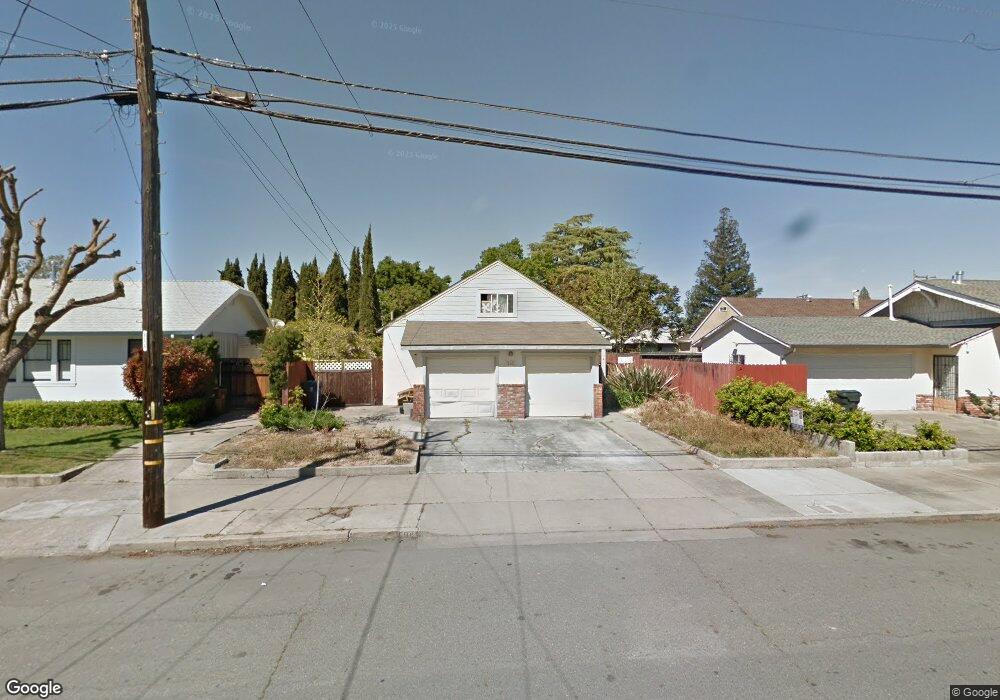
508 W 13th St Antioch, CA 94509
North Antioch NeighborhoodEstimated Value: $490,000 - $570,000
4
Beds
2
Baths
1,473
Sq Ft
$355/Sq Ft
Est. Value
About This Home
This home is located at 508 W 13th St, Antioch, CA 94509 and is currently estimated at $522,615, approximately $354 per square foot. 508 W 13th St is a home located in Contra Costa County with nearby schools including Fremont Elementary School, Antioch Middle School, and Antioch High School.
Ownership History
Date
Name
Owned For
Owner Type
Purchase Details
Closed on
Dec 13, 2018
Sold by
Dusza Shirley
Bought by
Fryerson Shanica
Current Estimated Value
Home Financials for this Owner
Home Financials are based on the most recent Mortgage that was taken out on this home.
Original Mortgage
$371,153
Outstanding Balance
$326,994
Interest Rate
4.8%
Mortgage Type
FHA
Estimated Equity
$195,621
Purchase Details
Closed on
May 14, 2004
Sold by
Grimes Bob
Bought by
Grimes Denise
Home Financials for this Owner
Home Financials are based on the most recent Mortgage that was taken out on this home.
Original Mortgage
$142,400
Interest Rate
5.5%
Mortgage Type
Purchase Money Mortgage
Purchase Details
Closed on
May 11, 2004
Sold by
Grimes Denise
Bought by
Dusza Thomas and Dusza Shirley
Home Financials for this Owner
Home Financials are based on the most recent Mortgage that was taken out on this home.
Original Mortgage
$142,400
Interest Rate
5.5%
Mortgage Type
Purchase Money Mortgage
Purchase Details
Closed on
Jun 24, 2003
Sold by
Grimes Bob
Bought by
Grimes Denise
Purchase Details
Closed on
Jun 25, 2001
Sold by
Pilkington David and Pilkington Cherie
Bought by
Grimes Bob and Grimes Denise
Home Financials for this Owner
Home Financials are based on the most recent Mortgage that was taken out on this home.
Original Mortgage
$141,550
Interest Rate
7.5%
Mortgage Type
Purchase Money Mortgage
Purchase Details
Closed on
Mar 6, 1998
Sold by
Padilla Juan and Padilla Jean
Bought by
Pilkington David and Pilkington Cherie
Home Financials for this Owner
Home Financials are based on the most recent Mortgage that was taken out on this home.
Original Mortgage
$104,000
Interest Rate
7.11%
Mortgage Type
Purchase Money Mortgage
Purchase Details
Closed on
Sep 13, 1996
Sold by
Gromm Robert D
Bought by
Pilkington David and Pilkington Cherie
Home Financials for this Owner
Home Financials are based on the most recent Mortgage that was taken out on this home.
Original Mortgage
$77,030
Interest Rate
6.75%
Mortgage Type
Seller Take Back
Create a Home Valuation Report for This Property
The Home Valuation Report is an in-depth analysis detailing your home's value as well as a comparison with similar homes in the area
Home Values in the Area
Average Home Value in this Area
Purchase History
| Date | Buyer | Sale Price | Title Company |
|---|---|---|---|
| Fryerson Shanica | $378,000 | North American Title Company | |
| Grimes Denise | -- | First American Title | |
| Dusza Thomas | $178,000 | First American Title | |
| Grimes Denise | -- | -- | |
| Grimes Bob | $177,000 | Fidelity National Title Co | |
| Pilkington David | $104,000 | -- | |
| Pilkington David | $86,000 | First American Title Guarant |
Source: Public Records
Mortgage History
| Date | Status | Borrower | Loan Amount |
|---|---|---|---|
| Open | Fryerson Shanica | $371,153 | |
| Previous Owner | Dusza Thomas | $142,400 | |
| Previous Owner | Grimes Bob | $141,550 | |
| Previous Owner | Pilkington David | $104,000 | |
| Previous Owner | Pilkington David | $77,030 | |
| Closed | Grimes Bob | $35,450 |
Source: Public Records
Tax History Compared to Growth
Tax History
| Year | Tax Paid | Tax Assessment Tax Assessment Total Assessment is a certain percentage of the fair market value that is determined by local assessors to be the total taxable value of land and additions on the property. | Land | Improvement |
|---|---|---|---|---|
| 2025 | $9,086 | $421,661 | $289,809 | $131,852 |
| 2024 | $8,954 | $413,394 | $284,127 | $129,267 |
| 2023 | $8,954 | $405,289 | $278,556 | $126,733 |
| 2022 | $8,876 | $397,344 | $273,095 | $124,249 |
| 2021 | $8,682 | $389,554 | $267,741 | $121,813 |
| 2019 | $4,710 | $378,000 | $259,800 | $118,200 |
| 2018 | $4,039 | $324,877 | $218,670 | $106,207 |
| 2017 | $3,397 | $269,500 | $181,396 | $88,104 |
| 2016 | $3,083 | $243,000 | $163,559 | $79,441 |
| 2015 | $2,544 | $194,000 | $130,578 | $63,422 |
| 2014 | $2,275 | $173,000 | $116,443 | $56,557 |
Source: Public Records
Map
Nearby Homes