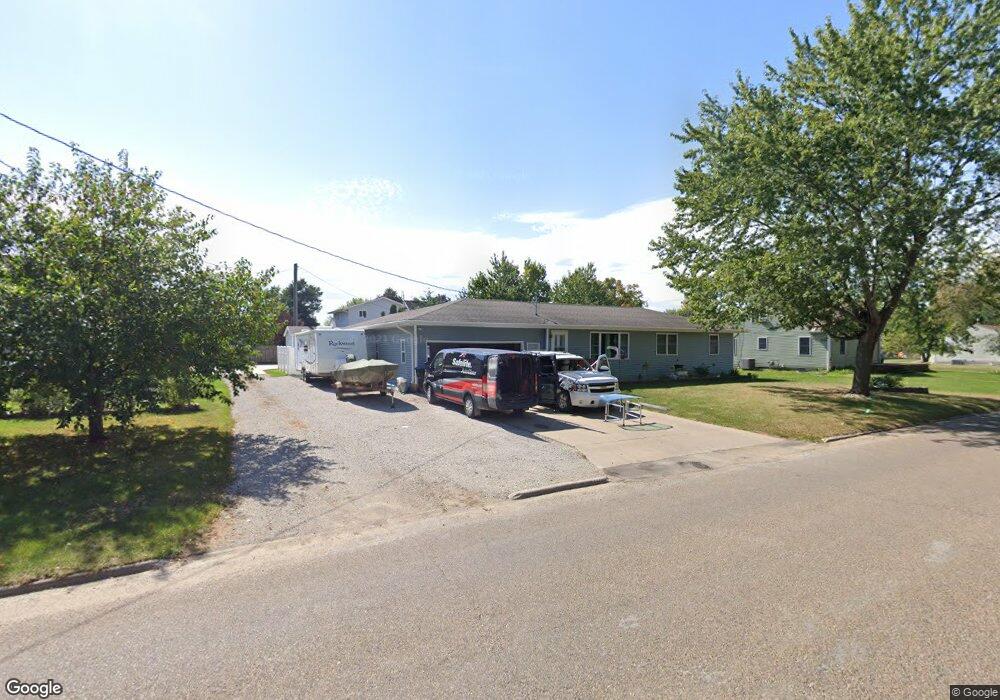
508 W 13th St Vinton, IA 52349
Estimated Value: $181,000 - $244,000
4
Beds
2
Baths
1,196
Sq Ft
$176/Sq Ft
Est. Value
About This Home
This home is located at 508 W 13th St, Vinton, IA 52349 and is currently estimated at $210,507, approximately $176 per square foot. 508 W 13th St is a home located in Benton County with nearby schools including Tilford Elementary School, Vinton-Shellsburg Middle School, and Vinton-Shellsburg High School.
Ownership History
Date
Name
Owned For
Owner Type
Purchase Details
Closed on
Aug 12, 2016
Sold by
Sharar Mark E and Sharar Amy J
Bought by
Libbert Brett and Libbert Brittany
Current Estimated Value
Purchase Details
Closed on
Aug 31, 2006
Sold by
Speidel Dale W and Speidel Myrna J
Bought by
Sharar Mark E and Sharar Amy J
Home Financials for this Owner
Home Financials are based on the most recent Mortgage that was taken out on this home.
Original Mortgage
$86,500
Interest Rate
6.88%
Mortgage Type
New Conventional
Create a Home Valuation Report for This Property
The Home Valuation Report is an in-depth analysis detailing your home's value as well as a comparison with similar homes in the area
Home Values in the Area
Average Home Value in this Area
Purchase History
| Date | Buyer | Sale Price | Title Company |
|---|---|---|---|
| Libbert Brett | -- | None Available | |
| Sharar Mark E | $108,500 | None Available |
Source: Public Records
Mortgage History
| Date | Status | Borrower | Loan Amount |
|---|---|---|---|
| Previous Owner | Sharar Mark E | $86,500 |
Source: Public Records
Tax History
| Year | Tax Paid | Tax Assessment Tax Assessment Total Assessment is a certain percentage of the fair market value that is determined by local assessors to be the total taxable value of land and additions on the property. | Land | Improvement |
|---|---|---|---|---|
| 2025 | $3,498 | $217,000 | $21,100 | $195,900 |
| 2024 | $3,498 | $196,900 | $21,100 | $175,800 |
| 2023 | $3,224 | $196,900 | $21,100 | $175,800 |
| 2022 | $3,308 | $158,700 | $16,900 | $141,800 |
| 2021 | $3,308 | $158,700 | $16,900 | $141,800 |
| 2020 | $3,152 | $154,500 | $14,400 | $140,100 |
| 2019 | $3,088 | $154,500 | $14,400 | $140,100 |
| 2018 | $2,996 | $149,400 | $13,600 | $135,800 |
| 2017 | $2,996 | $149,400 | $13,600 | $135,800 |
| 2016 | $2,118 | $106,900 | $12,700 | $94,200 |
| 2015 | $2,118 | $106,900 | $12,700 | $94,200 |
| 2014 | $2,344 | $117,100 | $0 | $0 |
Source: Public Records
Map
Nearby Homes
Your Personal Tour Guide
Ask me questions while you tour the home.