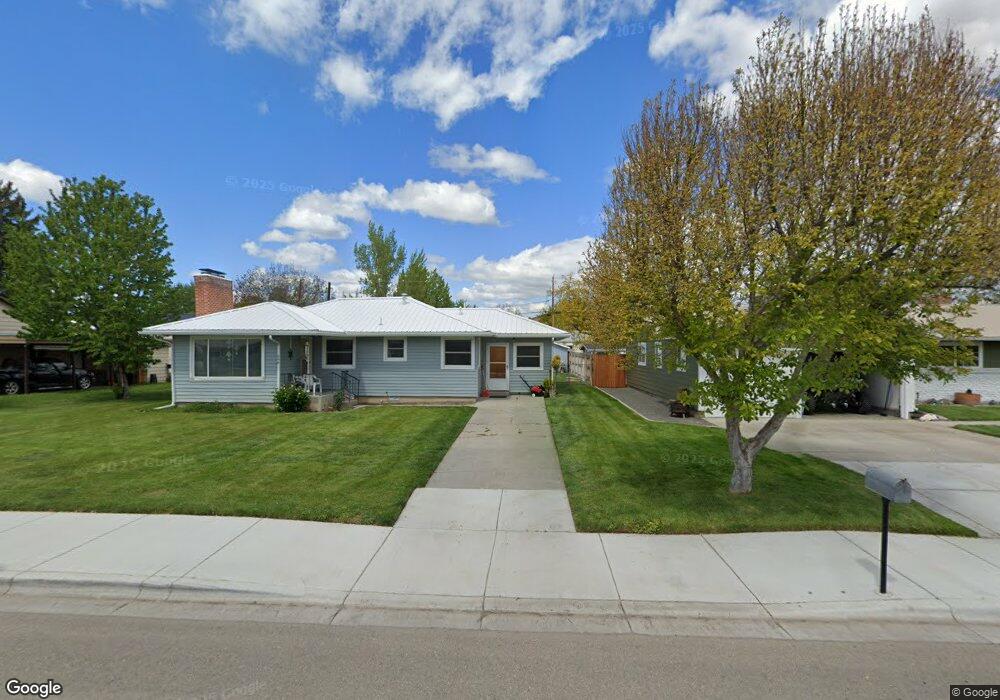
508 W Galloway Ave Weiser, ID 83672
Estimated Value: $286,000 - $310,000
2
Beds
1
Bath
1,220
Sq Ft
$242/Sq Ft
Est. Value
About This Home
This home is located at 508 W Galloway Ave, Weiser, ID 83672 and is currently estimated at $295,542, approximately $242 per square foot. 508 W Galloway Ave is a home located in Washington County with nearby schools including Pioneer Primary School, Park Intermediate School, and Weiser Middle School.
Ownership History
Date
Name
Owned For
Owner Type
Purchase Details
Closed on
Oct 28, 2025
Sold by
Wilson Ralph H
Bought by
Barbara J Berry Revocable Living Trust and Berry
Current Estimated Value
Purchase Details
Closed on
May 27, 2020
Sold by
Wilson Phyllis
Bought by
Wilson Phyllis and Wilson Ralph H
Purchase Details
Closed on
Mar 23, 2011
Sold by
Wilson Ralph H
Bought by
Wilson Phyllis
Purchase Details
Closed on
Nov 16, 2009
Sold by
Dillion James P
Bought by
Wilson Ralph and Wilson Phyllis
Purchase Details
Closed on
Oct 4, 2005
Sold by
Rietzke Robert D
Bought by
Dillion James P
Home Financials for this Owner
Home Financials are based on the most recent Mortgage that was taken out on this home.
Original Mortgage
$101,850
Interest Rate
5.72%
Mortgage Type
Purchase Money Mortgage
Create a Home Valuation Report for This Property
The Home Valuation Report is an in-depth analysis detailing your home's value as well as a comparison with similar homes in the area
Home Values in the Area
Average Home Value in this Area
Purchase History
We collect this data history from publicly available records. To have your information removed, we recommend requesting removal directly through your county’s website.
| Date | Buyer | Sale Price | Title Company |
|---|---|---|---|
| Barbara J Berry Revocable Living Trust | -- | Amerititle | |
| Wilson Phyllis | -- | None Available | |
| Wilson Phyllis | -- | -- | |
| Wilson Ralph | -- | -- | |
| Dillion James P | -- | -- |
Source: Public Records
Mortgage History
We collect this data history from publicly available records. To have your information removed, we recommend requesting removal directly through your county’s website.
| Date | Status | Borrower | Loan Amount |
|---|---|---|---|
| Previous Owner | Dillion James P | $101,850 |
Source: Public Records
Map
Nearby Homes
- 512 E Galloway Ave
- 500 E Galloway Ave
- 514 E Galloway Ave
- 519 E Butterfield St
- 505 E Galloway Ave
- 518 E Galloway Ave
- 920 E 5th St
- 507 E Galloway Ave
- 503 E Galloway Ave
- 509 E Galloway Ave
- 515 E Butterfield St
- 498 E Galloway Ave
- 522 E Galloway Ave
- 511 E Galloway Ave
- 525 E Butterfield St
- 527 E Butterfield St
- 524 E Galloway Ave
- 478 E Galloway Ave
- 517 E Galloway Ave
Your Personal Tour Guide
Ask me questions while you tour the home.