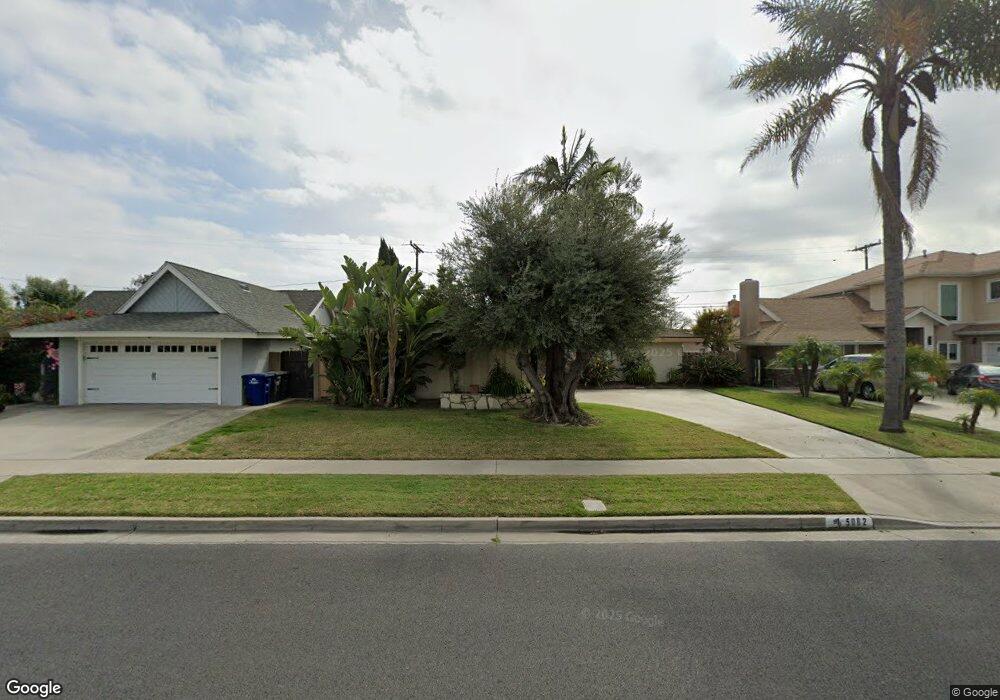
5082 Antietam Ave Los Alamitos, CA 90720
Estimated Value: $1,129,000 - $1,305,000
4
Beds
2
Baths
1,659
Sq Ft
$714/Sq Ft
Est. Value
About This Home
This home is located at 5082 Antietam Ave, Los Alamitos, CA 90720 and is currently estimated at $1,184,025, approximately $713 per square foot. 5082 Antietam Ave is a home located in Orange County with nearby schools including Los Alamitos Elementary School, Jack L. Weaver Elementary School, and Sharon Christa Mcauliffe Middle School.
Ownership History
Date
Name
Owned For
Owner Type
Purchase Details
Closed on
Mar 6, 2019
Sold by
Bruce Johnnie Sue
Bought by
Bruce Johnnie Sue and Johnnie Sue Bruce Living Trust
Current Estimated Value
Purchase Details
Closed on
Apr 20, 2016
Sold by
Bruce Johnnie Sue
Bought by
Bruce Johnnie Sue
Purchase Details
Closed on
Oct 27, 2005
Sold by
Morrison Wynona B
Bought by
Morrison Wynona B and Wynona B Morrison Living Trust
Purchase Details
Closed on
Sep 19, 2005
Sold by
Kennedy Wilma J
Bought by
Morrison Wynona B
Purchase Details
Closed on
Sep 7, 2005
Sold by
Bruce Johnnie Sue M
Bought by
Morrison Wynona B
Purchase Details
Closed on
Mar 22, 1995
Sold by
Morrison Wynona B
Bought by
Morrison Wynona B and Bruce Johnnie Sue M
Purchase Details
Closed on
Feb 16, 1995
Sold by
Morrison Wynona B and Bruce Johnnie Sue M
Bought by
Morrison Wynona B
Purchase Details
Closed on
Feb 11, 1995
Sold by
Kennedy Wilma J and Kennedy George B
Bought by
Morrison Wynona B
Create a Home Valuation Report for This Property
The Home Valuation Report is an in-depth analysis detailing your home's value as well as a comparison with similar homes in the area
Home Values in the Area
Average Home Value in this Area
Purchase History
| Date | Buyer | Sale Price | Title Company |
|---|---|---|---|
| Bruce Johnnie Sue | -- | None Available | |
| Bruce Johnnie Sue | -- | None Available | |
| Morrison Wynona B | -- | -- | |
| Morrison Wynona B | -- | -- | |
| Morrison Wynona B | -- | -- | |
| Morrison Wynona B | -- | -- | |
| Morrison Wynona B | -- | -- | |
| Morrison Wynona B | -- | -- |
Source: Public Records
Tax History Compared to Growth
Tax History
| Year | Tax Paid | Tax Assessment Tax Assessment Total Assessment is a certain percentage of the fair market value that is determined by local assessors to be the total taxable value of land and additions on the property. | Land | Improvement |
|---|---|---|---|---|
| 2025 | $3,119 | $251,251 | $125,760 | $125,491 |
| 2024 | $3,119 | $246,325 | $123,294 | $123,031 |
| 2023 | $3,048 | $241,496 | $120,877 | $120,619 |
| 2022 | $3,033 | $236,761 | $118,507 | $118,254 |
| 2021 | $2,972 | $232,119 | $116,183 | $115,936 |
| 2020 | $2,982 | $229,739 | $114,991 | $114,748 |
| 2019 | $3,092 | $225,235 | $112,736 | $112,499 |
| 2018 | $2,742 | $220,819 | $110,525 | $110,294 |
| 2017 | $2,687 | $216,490 | $108,358 | $108,132 |
| 2016 | $2,564 | $212,246 | $106,234 | $106,012 |
| 2015 | $2,535 | $209,058 | $104,638 | $104,420 |
| 2014 | $2,449 | $204,963 | $102,588 | $102,375 |
Source: Public Records
Map
Nearby Homes
- 11091 Ranger Dr
- 4411 Farquhar Ave
- 5092 Citation Ave
- 4311 Howard Ave
- 5633 Lakia Dr
- 11676 Lakia Dr
- 5041 Myra Ave
- 4777 Larwin Ave
- 11901 Saint Mark St
- 10424 Santa Rita St
- 10191 Virgil Cir
- 4418 Larwin Ave
- 4481 Larwin Ave
- 6056 Palau St
- 4286 Dina Ct
- 3845 Farquhar Ave
- 3845 Farquhar Ave Unit 110
- 4177 Elizabeth Ct
- 10202 Aqueduct Dr
- 3802 Howard Ave
- 5072 Antietam Ave
- 5092 Antietam Ave
- 5081 Kearsarge Ave
- 5071 Kearsarge Ave
- 5091 Kearsarge Ave
- 5062 Antietam Ave
- 5112 Antietam Ave
- 5061 Kearsarge Ave
- 5111 Kearsarge Ave
- 5081 Antietam Ave
- 5071 Antietam Ave
- 5091 Antietam Ave
- 5052 Antietam Ave
- 5122 Antietam Ave
- 5061 Antietam Ave
- 5051 Kearsarge Ave
- 5121 Kearsarge Ave
- 5032 Antietam Ave
- 5132 Antietam Ave
- 5041 Antietam Ave