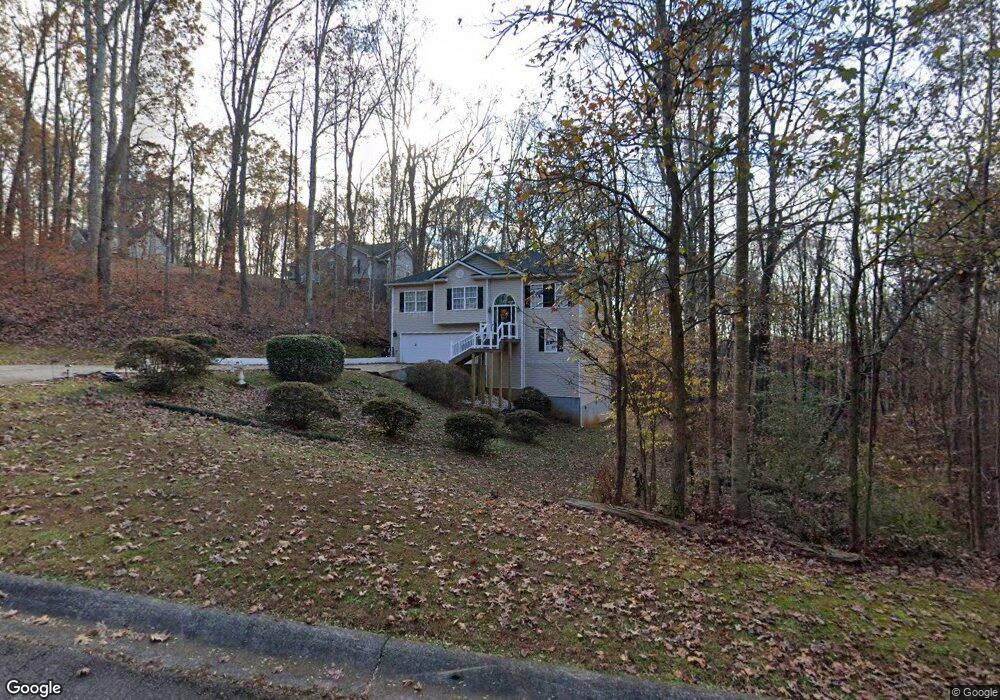
5082 Peach Mountain Cir Unit 82420 Gainesville, GA 30507
Estimated Value: $358,000 - $422,000
3
Beds
2
Baths
1,276
Sq Ft
$301/Sq Ft
Est. Value
About This Home
This home is located at 5082 Peach Mountain Cir Unit 82420, Gainesville, GA 30507 and is currently estimated at $384,033, approximately $300 per square foot. 5082 Peach Mountain Cir Unit 82420 is a home located in Hall County with nearby schools including Myers Elementary School, Cherokee Bluff Middle School, and Cherokee Bluff High School.
Ownership History
Date
Name
Owned For
Owner Type
Purchase Details
Closed on
Oct 14, 2015
Sold by
Thompson Diane
Bought by
Fash Jr Joseph and Fash Jr Diane R
Current Estimated Value
Purchase Details
Closed on
Oct 13, 2015
Sold by
Thompson Diane Ruth
Bought by
Fash Joseph and Fash Diane Ruth
Purchase Details
Closed on
Jul 2, 2013
Sold by
Trantham Chris
Bought by
Thompson Diane
Purchase Details
Closed on
Aug 31, 2004
Sold by
Chris Cagle Construction Inc
Bought by
Trantham Chris and Trantham Angela
Home Financials for this Owner
Home Financials are based on the most recent Mortgage that was taken out on this home.
Original Mortgage
$109,200
Interest Rate
5.91%
Mortgage Type
New Conventional
Purchase Details
Closed on
Jun 13, 2001
Sold by
Hampton James Ralph
Bought by
Young Richard Hampton
Create a Home Valuation Report for This Property
The Home Valuation Report is an in-depth analysis detailing your home's value as well as a comparison with similar homes in the area
Home Values in the Area
Average Home Value in this Area
Purchase History
| Date | Buyer | Sale Price | Title Company |
|---|---|---|---|
| Fash Jr Joseph | $127,500 | -- | |
| Fash Joseph | -- | -- | |
| Thompson Diane | $115,000 | -- | |
| Trantham Chris | $136,500 | -- | |
| Young Richard Hampton | -- | -- |
Source: Public Records
Mortgage History
| Date | Status | Borrower | Loan Amount |
|---|---|---|---|
| Previous Owner | Trantham Chris | $109,200 |
Source: Public Records
Tax History Compared to Growth
Tax History
| Year | Tax Paid | Tax Assessment Tax Assessment Total Assessment is a certain percentage of the fair market value that is determined by local assessors to be the total taxable value of land and additions on the property. | Land | Improvement |
|---|---|---|---|---|
| 2024 | $1,259 | $142,720 | $35,880 | $106,840 |
| 2023 | $1,240 | $152,400 | $35,880 | $116,520 |
| 2022 | $1,241 | $128,400 | $35,880 | $92,520 |
| 2021 | $850 | $79,040 | $5,960 | $73,080 |
| 2020 | $836 | $75,880 | $5,960 | $69,920 |
| 2019 | $807 | $71,120 | $5,960 | $65,160 |
| 2018 | $744 | $62,960 | $5,960 | $57,000 |
| 2017 | $594 | $51,072 | $5,960 | $45,112 |
| 2016 | $546 | $51,072 | $5,960 | $45,112 |
| 2015 | $1,477 | $50,992 | $5,880 | $45,112 |
| 2014 | $1,477 | $50,992 | $5,880 | $45,112 |
Source: Public Records
Map
Nearby Homes
- 5074 Peach Mountain Cir
- 4947 Weaver Rd
- 5055 Peach Mountain Cir
- 5116 Deer Path Ln
- 3016 Candler Rd
- 7330 Berry Hill Dr
- 4807 Sherman Allen Rd
- 3263 Tanners Mill Rd
- 7367 Berry Hill Dr
- 4715 Creek Wood Dr
- 3325 Tanners Mill Rd
- 4745 Shady Lake Cir
- 1 Cooper Bridge Rd
- 3 Cooper Bridge Rd
- 4813 River Bottom Dr
- 2820 Glendale Dr
- 2825 Glendale Dr
- 3455 Navigator Ln
- 5082 Peach Mountain Cir
- 5086 Peach Mountain Cir
- 5090 Peach Mountain Cir
- 5083 Peach Mountain Cir
- 5094 Peach Mountain Cir
- 5079 Peach Mountain
- 5079 Peach Mountain Cir
- 5087 Peach Mountain Cir
- 5071 Peach Mountain Cir
- 5091 Peach Mountain Cir
- 5100 Peach Mountain Cir
- 5107 Deer Path Ln
- 5095 Peach Mountain Cir
- 5067 Peach Mountain Cir
- 5115 Deer Path Ln
- 5099 Peach Mountain Cir
- 4945 Weaver Rd
- 4947 Weaver Rd Unit 25
- 5063 Peach Mountain Cir
- 4949 Weaver Rd