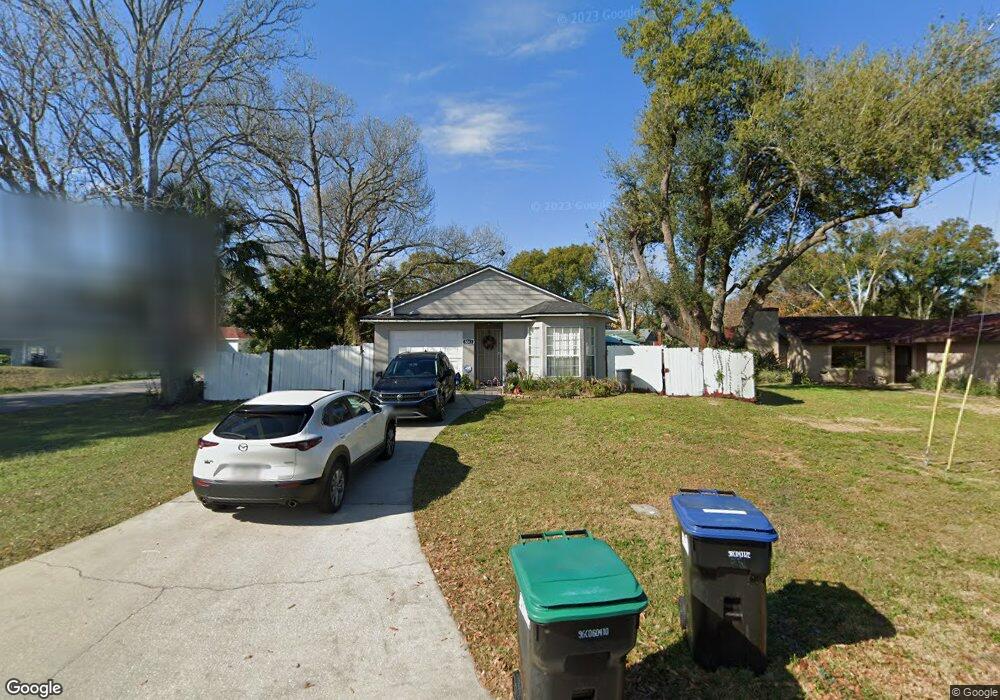
5083 Barton Dr Orlando, FL 32807
Estimated Value: $331,000 - $371,000
3
Beds
2
Baths
1,200
Sq Ft
$293/Sq Ft
Est. Value
About This Home
This home is located at 5083 Barton Dr, Orlando, FL 32807 and is currently estimated at $351,939, approximately $293 per square foot. 5083 Barton Dr is a home located in Orange County with nearby schools including Baldwin Park Elementary, Glenridge Middle, and Winter Park High.
Ownership History
Date
Name
Owned For
Owner Type
Purchase Details
Closed on
Apr 23, 2015
Sold by
Moonguaklang Sukanya
Bought by
Moonguaklang Sukanya
Current Estimated Value
Purchase Details
Closed on
Oct 13, 2005
Sold by
Yarkhom Sudarat and Yarkhom Sumneng
Bought by
Moonguaklang Pim
Home Financials for this Owner
Home Financials are based on the most recent Mortgage that was taken out on this home.
Original Mortgage
$84,800
Interest Rate
6%
Mortgage Type
Fannie Mae Freddie Mac
Purchase Details
Closed on
Feb 11, 2003
Sold by
Compton Estel and Compton Mary
Bought by
Yarkhom Sudarat and Yarkhom Sumneng
Home Financials for this Owner
Home Financials are based on the most recent Mortgage that was taken out on this home.
Original Mortgage
$103,377
Interest Rate
5.82%
Mortgage Type
FHA
Create a Home Valuation Report for This Property
The Home Valuation Report is an in-depth analysis detailing your home's value as well as a comparison with similar homes in the area
Purchase History
| Date | Buyer | Sale Price | Title Company |
|---|---|---|---|
| Moonguaklang Sukanya | -- | None Available | |
| Moonguaklang Pim | $106,000 | Southern Title Holding Compa | |
| Yarkhom Sudarat | $105,000 | American Pioneer Title Insur |
Source: Public Records
Mortgage History
| Date | Status | Borrower | Loan Amount |
|---|---|---|---|
| Previous Owner | Moonguaklang Pim | $84,800 | |
| Previous Owner | Yarkhom Sudarat | $103,377 |
Source: Public Records
Tax History
| Year | Tax Paid | Tax Assessment Tax Assessment Total Assessment is a certain percentage of the fair market value that is determined by local assessors to be the total taxable value of land and additions on the property. | Land | Improvement |
|---|---|---|---|---|
| 2025 | $4,406 | $212,263 | -- | -- |
| 2024 | $3,652 | $192,966 | -- | -- |
| 2023 | $3,652 | $294,625 | $85,000 | $209,625 |
| 2022 | $3,065 | $226,471 | $60,000 | $166,471 |
| 2021 | $2,788 | $193,734 | $60,000 | $133,734 |
| 2020 | $2,432 | $170,159 | $60,000 | $110,159 |
| 2019 | $2,471 | $171,105 | $60,000 | $111,105 |
| 2018 | $2,178 | $138,737 | $40,000 | $98,737 |
| 2017 | $2,026 | $127,858 | $40,000 | $87,858 |
| 2016 | $1,925 | $123,449 | $40,000 | $83,449 |
| 2015 | $1,777 | $107,146 | $28,000 | $79,146 |
| 2014 | -- | $96,312 | $23,000 | $73,312 |
Source: Public Records
Map
Nearby Homes
- 793 Eldridge St
- 1927 Risby Aly Unit 19
- 1927 Risby Aly
- 921 Eldridge St
- 861 High St
- 972 Baldwin Cove Way
- 1926 Risby Aly Unit 16
- 812 High St
- 5314 Old Cheney Hwy
- 4715 Beach Blvd
- 814 Irwin Dr
- 1009 Jamajo Blvd
- 1014 N Solandra Dr
- 4330 Rixey St
- 4333 Roush Ave
- 4329 Roush Ave
- 1224 Turrisi Blvd
- 4317 Roush Ave
- 1333 Susannah Blvd
- 4313 Roush Ave
- 5105 Barton Dr
- 5041 Gypsy Ln
- 5025 Barton Dr
- 5109 Barton Dr
- 5060 Gypsy Ln
- 5035 Gypsy Ln
- 5056 Gypsy Ln
- 5017 Barton Dr
- 5100 Barton Dr
- 5034 Barton Dr
- 5042 Barton Dr
- 5040 Gypsy Ln
- 5026 Barton Dr
- 5108 Barton Dr
- 5108 Old Cheney Hwy
- 5031 Santa Rosa Dr
- 0 Santa Rosa Dr Unit O5521322
- 5015 Santa Rosa Dr
- 5005 Gypsy Ln
- 5110 Old Cheney Hwy Unit A
Your Personal Tour Guide
Ask me questions while you tour the home.