Estimated Value: $460,000 - $559,000
5
Beds
3
Baths
3,215
Sq Ft
$155/Sq Ft
Est. Value
About This Home
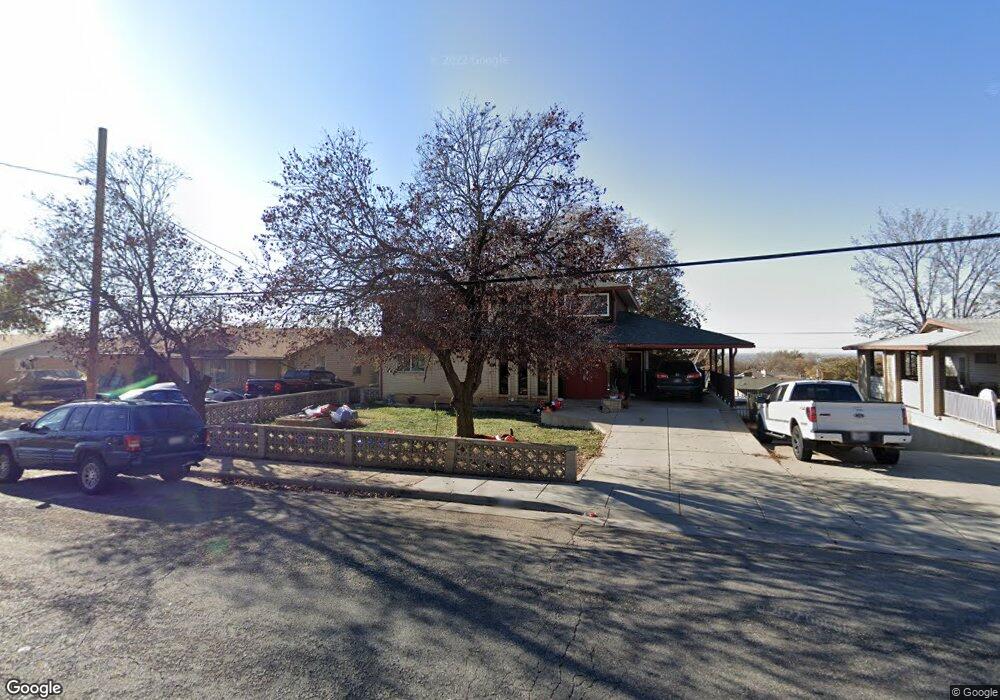
This home is located at 5085 S 2500 W, Roy, UT 84067 and is currently estimated at $496,993, approximately $154 per square foot. 5085 S 2500 W is a home located in Weber County with nearby schools including Lakeview Elementary School, Roy Junior High School, and Roy High School.
Ownership History
Date
Name
Owned For
Owner Type
Purchase Details
Closed on
Jan 14, 2022
Sold by
Brasseur and Jennifer
Bought by
Nell Jason and Nell Adrienne
Current Estimated Value
Purchase Details
Closed on
Jul 6, 2018
Sold by
Ainsworth Tyler
Bought by
Brasseur Ray and Brasseur Jennifer
Home Financials for this Owner
Home Financials are based on the most recent Mortgage that was taken out on this home.
Original Mortgage
$270,019
Interest Rate
4.5%
Mortgage Type
FHA
Purchase Details
Closed on
Jul 2, 2004
Sold by
Workman Kenneth M and Workman Ann E
Bought by
Workman Kenneth and Workman Ann E
Purchase Details
Closed on
Jun 2, 2004
Sold by
Workman Kenneth M and Workman Ann E
Bought by
Workman Kenneth and Workman Ann E
Create a Home Valuation Report for This Property
The Home Valuation Report is an in-depth analysis detailing your home's value as well as a comparison with similar homes in the area
Home Values in the Area
Average Home Value in this Area
Purchase History
| Date | Buyer | Sale Price | Title Company |
|---|---|---|---|
| Nell Jason | -- | None Listed On Document | |
| Brasseur Ray | -- | Heritage West Title | |
| Workman Kenneth | -- | -- | |
| Workman Kenneth | -- | -- |
Source: Public Records
Mortgage History
| Date | Status | Borrower | Loan Amount |
|---|---|---|---|
| Previous Owner | Brasseur Ray | $270,019 |
Source: Public Records
Tax History
| Year | Tax Paid | Tax Assessment Tax Assessment Total Assessment is a certain percentage of the fair market value that is determined by local assessors to be the total taxable value of land and additions on the property. | Land | Improvement |
|---|---|---|---|---|
| 2025 | $2,858 | $457,332 | $115,672 | $341,660 |
| 2024 | $2,786 | $246,949 | $63,620 | $183,329 |
| 2023 | $2,633 | $233,200 | $61,354 | $171,846 |
| 2022 | $2,798 | $256,300 | $53,792 | $202,508 |
| 2021 | $2,288 | $344,000 | $68,071 | $275,929 |
| 2020 | $2,112 | $291,000 | $68,071 | $222,929 |
| 2019 | $2,135 | $278,000 | $40,016 | $237,984 |
| 2018 | $2,000 | $244,000 | $36,015 | $207,985 |
| 2017 | $190 | $229,487 | $36,015 | $193,472 |
| 2016 | $188 | $112,068 | $18,525 | $93,543 |
| 2015 | $1,656 | $104,085 | $15,708 | $88,377 |
| 2014 | $1,599 | $99,007 | $15,708 | $83,299 |
Source: Public Records
Map
Nearby Homes
Your Personal Tour Guide
Ask me questions while you tour the home.