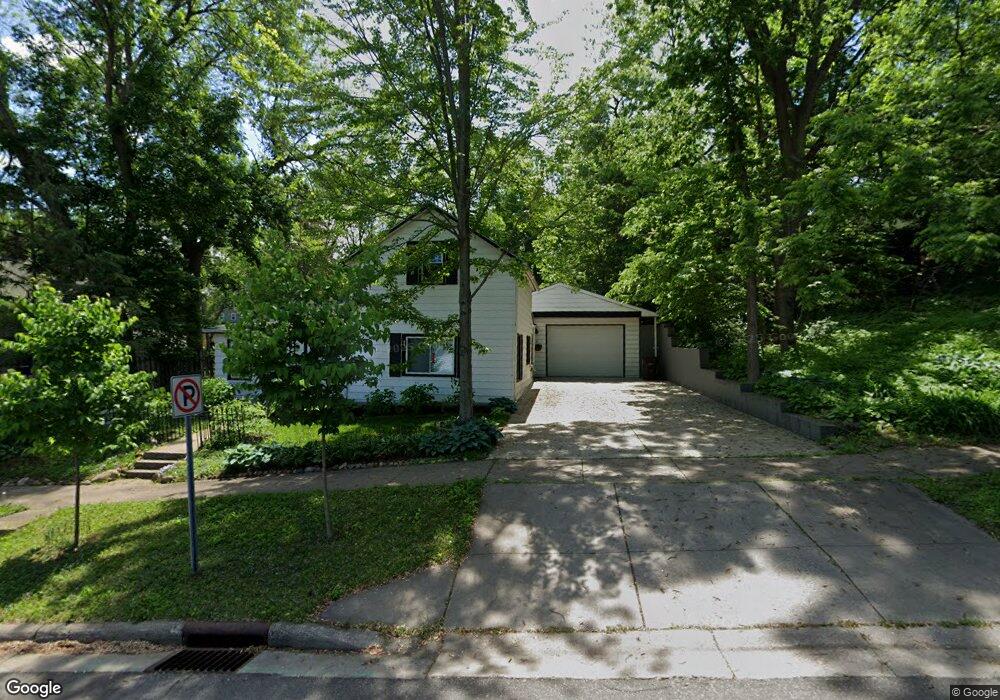
509 3rd St W Hastings, MN 55033
Hastings-Marshan Township NeighborhoodEstimated Value: $233,007 - $264,000
3
Beds
1
Bath
983
Sq Ft
$257/Sq Ft
Est. Value
About This Home
This home is located at 509 3rd St W, Hastings, MN 55033 and is currently estimated at $252,752, approximately $257 per square foot. 509 3rd St W is a home located in Dakota County with nearby schools including Hastings Middle School, Christa Mcauliffe Elementary School, and Hastings High School.
Ownership History
Date
Name
Owned For
Owner Type
Purchase Details
Closed on
Jan 15, 2015
Current Estimated Value
Purchase Details
Closed on
Feb 8, 2013
Sold by
Jpmorgan Chase Bank National Association
Bought by
Secretary Of Housing & Urban Development
Purchase Details
Closed on
Sep 22, 2008
Sold by
Walther Barbara and Whited Michael
Bought by
Duffy Darin and Duffy Amber
Purchase Details
Closed on
Jul 21, 2000
Sold by
Feidt Michael E and Feidt Karen S
Bought by
Woehl Jeffrey S and Woehl Teresa L
Create a Home Valuation Report for This Property
The Home Valuation Report is an in-depth analysis detailing your home's value as well as a comparison with similar homes in the area
Home Values in the Area
Average Home Value in this Area
Purchase History
| Date | Buyer | Sale Price | Title Company |
|---|---|---|---|
| -- | $52,500 | -- | |
| Future & Hope Investments Llc | -- | Edina Realty Title | |
| Secretary Of Housing & Urban Development | -- | None Available | |
| Duffy Darin | $157,500 | -- | |
| Woehl Jeffrey S | $116,000 | -- |
Source: Public Records
Tax History Compared to Growth
Tax History
| Year | Tax Paid | Tax Assessment Tax Assessment Total Assessment is a certain percentage of the fair market value that is determined by local assessors to be the total taxable value of land and additions on the property. | Land | Improvement |
|---|---|---|---|---|
| 2024 | $2,452 | $208,600 | $63,900 | $144,700 |
| 2023 | $2,452 | $212,300 | $63,900 | $148,400 |
| 2022 | $1,962 | $197,900 | $63,800 | $134,100 |
| 2021 | $1,856 | $159,300 | $51,100 | $108,200 |
| 2020 | $1,968 | $149,700 | $48,700 | $101,000 |
| 2019 | $1,893 | $153,400 | $46,300 | $107,100 |
| 2018 | $1,788 | $140,000 | $44,100 | $95,900 |
| 2017 | $1,585 | $127,700 | $42,000 | $85,700 |
| 2016 | $1,722 | $112,600 | $39,300 | $73,300 |
| 2015 | $1,819 | $119,200 | $38,100 | $81,100 |
| 2014 | -- | $121,800 | $36,700 | $85,100 |
| 2013 | -- | $77,755 | $24,469 | $53,286 |
Source: Public Records
Map
Nearby Homes