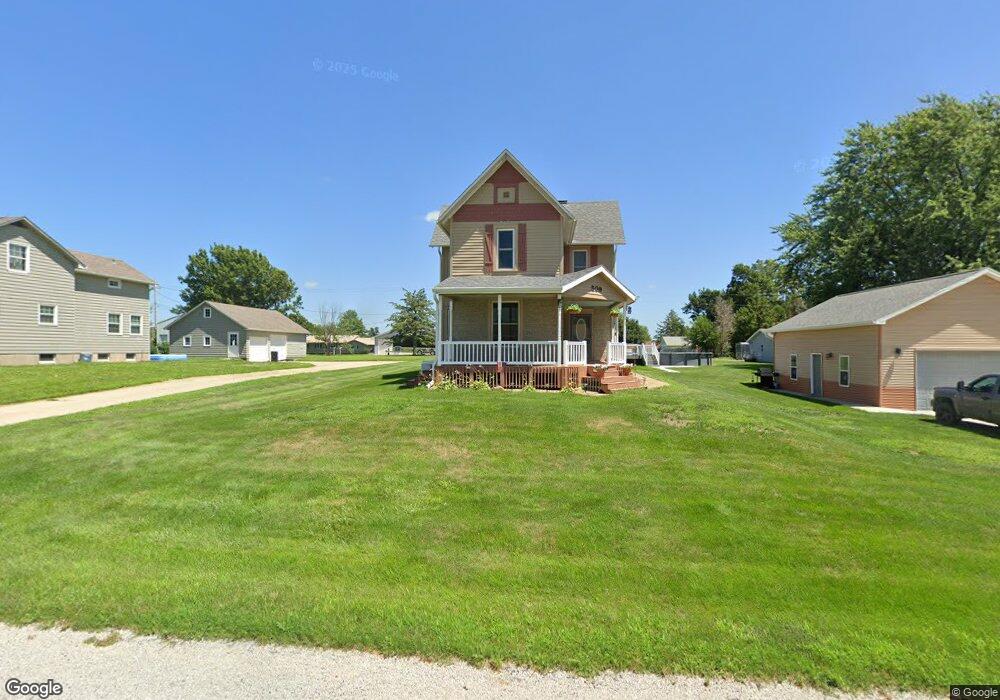
509 8th Ave Clarence, IA 52216
Estimated Value: $177,000 - $220,000
4
Beds
2
Baths
1,602
Sq Ft
$118/Sq Ft
Est. Value
About This Home
This home is located at 509 8th Ave, Clarence, IA 52216 and is currently estimated at $189,373, approximately $118 per square foot. 509 8th Ave is a home located in Cedar County with nearby schools including North Cedar Junior/Senior High School.
Ownership History
Date
Name
Owned For
Owner Type
Purchase Details
Closed on
Apr 19, 2023
Sold by
Groeber Deborah L and Groeber Thomas
Bought by
Sander Kayla D and Gallagher Chase L
Current Estimated Value
Home Financials for this Owner
Home Financials are based on the most recent Mortgage that was taken out on this home.
Original Mortgage
$125,000
Outstanding Balance
$121,141
Interest Rate
6.42%
Mortgage Type
New Conventional
Estimated Equity
$68,232
Purchase Details
Closed on
Oct 23, 2009
Sold by
Hsbc Bank Usa Na
Bought by
Buckmaster Deborah L
Purchase Details
Closed on
Aug 27, 2005
Sold by
Gehrls Steven W and Gehrls Stewart L
Bought by
Brockman Kimberly E
Home Financials for this Owner
Home Financials are based on the most recent Mortgage that was taken out on this home.
Original Mortgage
$57,800
Interest Rate
10.62%
Mortgage Type
Adjustable Rate Mortgage/ARM
Create a Home Valuation Report for This Property
The Home Valuation Report is an in-depth analysis detailing your home's value as well as a comparison with similar homes in the area
Home Values in the Area
Average Home Value in this Area
Purchase History
| Date | Buyer | Sale Price | Title Company |
|---|---|---|---|
| Sander Kayla D | $150,000 | None Listed On Document | |
| Buckmaster Deborah L | $23,000 | None Available | |
| Brockman Kimberly E | $68,000 | None Available |
Source: Public Records
Mortgage History
| Date | Status | Borrower | Loan Amount |
|---|---|---|---|
| Open | Sander Kayla D | $125,000 | |
| Previous Owner | Brockman Kimberly E | $57,800 |
Source: Public Records
Tax History Compared to Growth
Tax History
| Year | Tax Paid | Tax Assessment Tax Assessment Total Assessment is a certain percentage of the fair market value that is determined by local assessors to be the total taxable value of land and additions on the property. | Land | Improvement |
|---|---|---|---|---|
| 2025 | $2,304 | $176,510 | $22,980 | $153,530 |
| 2024 | $2,304 | $163,000 | $22,980 | $140,020 |
| 2023 | $2,078 | $152,730 | $22,980 | $129,750 |
| 2022 | $1,874 | $110,390 | $20,110 | $90,280 |
| 2021 | $1,910 | $110,390 | $20,110 | $90,280 |
| 2020 | $1,802 | $110,390 | $20,110 | $90,280 |
| 2019 | $1,372 | $77,480 | $0 | $0 |
| 2018 | $1,222 | $70,830 | $0 | $0 |
| 2017 | $1,222 | $71,100 | $0 | $0 |
| 2016 | $1,210 | $68,160 | $0 | $0 |
| 2015 | $1,196 | $68,160 | $0 | $0 |
| 2014 | $1,196 | $68,160 | $0 | $0 |
Source: Public Records
Map
Nearby Homes