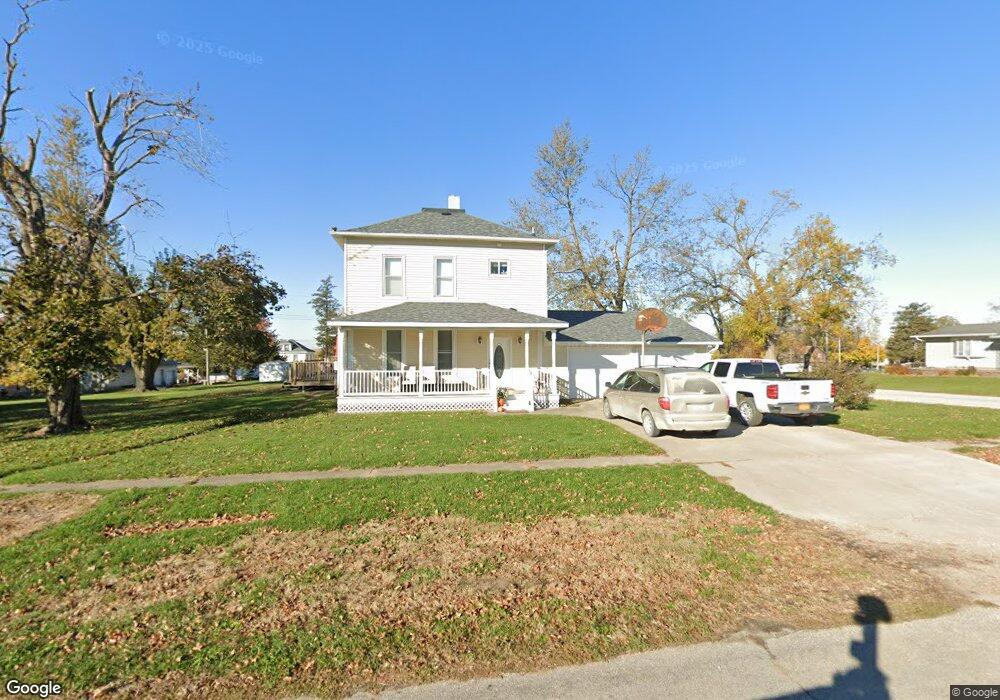
509 Clay St Malcom, IA 50157
Estimated Value: $140,415 - $178,000
3
Beds
2
Baths
1,749
Sq Ft
$91/Sq Ft
Est. Value
About This Home
This home is located at 509 Clay St, Malcom, IA 50157 and is currently estimated at $159,354, approximately $91 per square foot. 509 Clay St is a home located in Poweshiek County with nearby schools including Brooklyn-Guernsey-Malcom Elementary School and Brooklyn-Guernsey-Malcom Junior/Senior High School.
Ownership History
Date
Name
Owned For
Owner Type
Purchase Details
Closed on
Dec 30, 2019
Sold by
Dayton William R and Dayton Anna M
Bought by
Dayton Jacob and Dayton Wendy J
Current Estimated Value
Home Financials for this Owner
Home Financials are based on the most recent Mortgage that was taken out on this home.
Original Mortgage
$103,550
Outstanding Balance
$91,294
Interest Rate
3.6%
Mortgage Type
New Conventional
Estimated Equity
$68,060
Create a Home Valuation Report for This Property
The Home Valuation Report is an in-depth analysis detailing your home's value as well as a comparison with similar homes in the area
Purchase History
| Date | Buyer | Sale Price | Title Company |
|---|---|---|---|
| Dayton Jacob | $109,000 | None Available |
Source: Public Records
Mortgage History
| Date | Status | Borrower | Loan Amount |
|---|---|---|---|
| Open | Dayton Jacob | $103,550 |
Source: Public Records
Tax History
| Year | Tax Paid | Tax Assessment Tax Assessment Total Assessment is a certain percentage of the fair market value that is determined by local assessors to be the total taxable value of land and additions on the property. | Land | Improvement |
|---|---|---|---|---|
| 2025 | $1,656 | $112,930 | $8,230 | $104,700 |
| 2024 | $1,584 | $112,930 | $8,230 | $104,700 |
| 2023 | $1,386 | $112,930 | $8,230 | $104,700 |
| 2022 | $1,552 | $85,980 | $6,230 | $79,750 |
| 2021 | $1,552 | $81,120 | $5,880 | $75,240 |
| 2020 | $1,512 | $81,120 | $5,880 | $75,240 |
| 2019 | $1,562 | $81,120 | $5,880 | $75,240 |
| 2018 | $1,546 | $81,120 | $5,880 | $75,240 |
| 2017 | $1,572 | $81,120 | $5,880 | $75,240 |
| 2016 | $1,496 | $81,120 | $5,880 | $75,240 |
| 2015 | $1,496 | $81,120 | $5,880 | $75,240 |
| 2014 | $1,488 | $81,120 | $5,880 | $75,240 |
Source: Public Records
Map
Nearby Homes
- 303 Clay St
- 4182 160th St
- 215 Brady St
- 528 W Pershing Dr
- 515 W Des Moines St
- 505 W Pershing Dr
- 511 N Orchard St
- 404 W Des Moines St
- 611 Broadway St
- 508 Williams St
- 420 390th Ave
- 144 Center Point Dr
- 174A Center Point Dr
- 135 Crabtree Rd
- 4854 103rd St
- 204 Eastside Ln
- 380 Timber Ridge
- 226 & 228 Center Point Dr
- 101 Canyon Rd
- 212 Eastside Ln
Your Personal Tour Guide
Ask me questions while you tour the home.