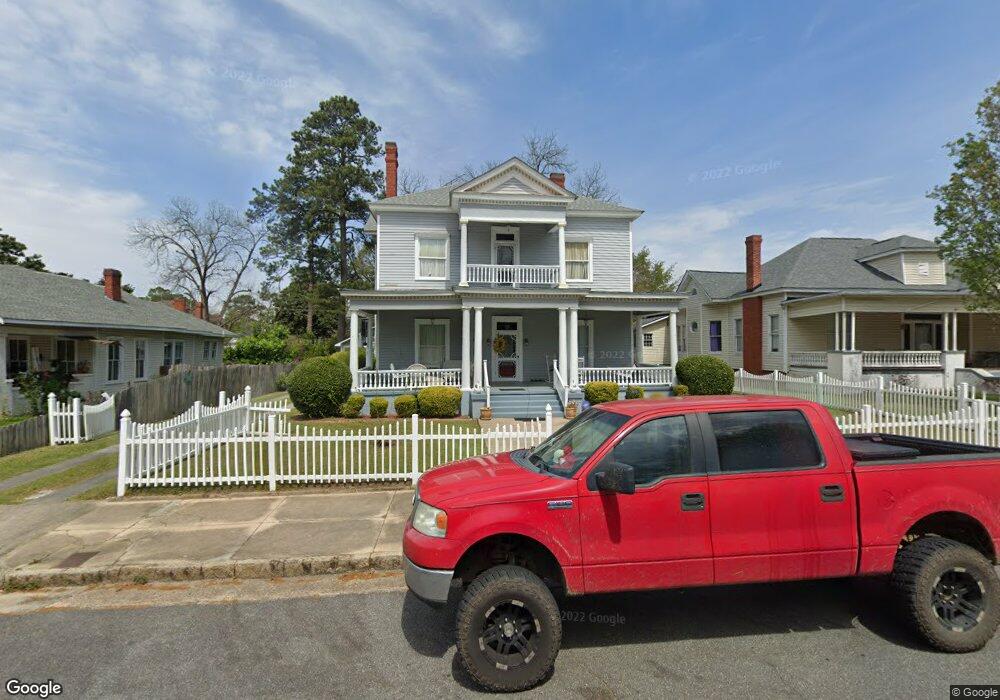
509 E 13th Ave Cordele, GA 31015
Estimated Value: $194,000 - $257,000
5
Beds
4
Baths
3,433
Sq Ft
$66/Sq Ft
Est. Value
About This Home
This home is located at 509 E 13th Ave, Cordele, GA 31015 and is currently estimated at $224,909, approximately $65 per square foot. 509 E 13th Ave is a home located in Crisp County with nearby schools including Crisp County Elementary School, Crisp County Primary School, and Crisp County Middle School.
Ownership History
Date
Name
Owned For
Owner Type
Purchase Details
Closed on
Jun 6, 2006
Sold by
Thomas Molly T
Bought by
Barnes & Thomas Inc
Current Estimated Value
Purchase Details
Closed on
Feb 18, 2004
Sold by
Thomas Molly T
Bought by
Barnes & Thomas Inc
Purchase Details
Closed on
Dec 2, 2003
Sold by
West John E
Bought by
Thomas Molly T
Purchase Details
Closed on
Sep 24, 2002
Sold by
West John E and West Ellen R
Bought by
West John E
Purchase Details
Closed on
Feb 12, 2002
Sold by
Sallee Sharry Lynne
Bought by
West John E and West Ellen R
Purchase Details
Closed on
Aug 4, 2001
Sold by
Malachi Darrin W and Bernice Brown
Bought by
Sallee Sharry Lynne
Purchase Details
Closed on
Oct 16, 2000
Sold by
Malachi Darin W
Bought by
Malachi Darrin W
Purchase Details
Closed on
Sep 7, 2000
Sold by
Sallee Sherry L
Bought by
Malachi Darin W and Bernice Brown
Purchase Details
Closed on
Jan 17, 1991
Sold by
Harvest International Ministries
Bought by
Sallee Sherry L
Create a Home Valuation Report for This Property
The Home Valuation Report is an in-depth analysis detailing your home's value as well as a comparison with similar homes in the area
Home Values in the Area
Average Home Value in this Area
Purchase History
| Date | Buyer | Sale Price | Title Company |
|---|---|---|---|
| Barnes & Thomas Inc | -- | -- | |
| Grantham James Charlie | $160,000 | -- | |
| Barnes & Thomas Inc | $45,000 | -- | |
| Thomas Molly T | $40,000 | -- | |
| West John E | -- | -- | |
| West John E | $29,500 | -- | |
| Sallee Sharry Lynne | -- | -- | |
| Malachi Darrin W | -- | -- | |
| Malachi Darin W | $54,000 | -- | |
| Sallee Sherry L | $26,200 | -- |
Source: Public Records
Tax History Compared to Growth
Tax History
| Year | Tax Paid | Tax Assessment Tax Assessment Total Assessment is a certain percentage of the fair market value that is determined by local assessors to be the total taxable value of land and additions on the property. | Land | Improvement |
|---|---|---|---|---|
| 2024 | -- | $87,824 | $2,250 | $85,574 |
| 2023 | $3,087 | $83,892 | $2,250 | $81,642 |
| 2022 | $3,087 | $79,015 | $2,250 | $76,765 |
| 2021 | $2,896 | $74,138 | $2,250 | $71,888 |
| 2020 | $3,011 | $74,138 | $2,250 | $71,888 |
| 2019 | $3,011 | $74,138 | $2,250 | $71,888 |
| 2018 | $467 | $31,727 | $2,250 | $29,477 |
| 2017 | $1,288 | $31,727 | $2,250 | $29,477 |
| 2016 | $468 | $31,727 | $2,250 | $29,477 |
| 2015 | -- | $31,727 | $2,250 | $29,477 |
| 2014 | -- | $31,727 | $2,250 | $29,477 |
| 2013 | -- | $31,726 | $2,250 | $29,476 |
Source: Public Records
Map
Nearby Homes