Estimated Value: $547,000 - $619,521
2
Beds
2
Baths
1,360
Sq Ft
$422/Sq Ft
Est. Value
About This Home
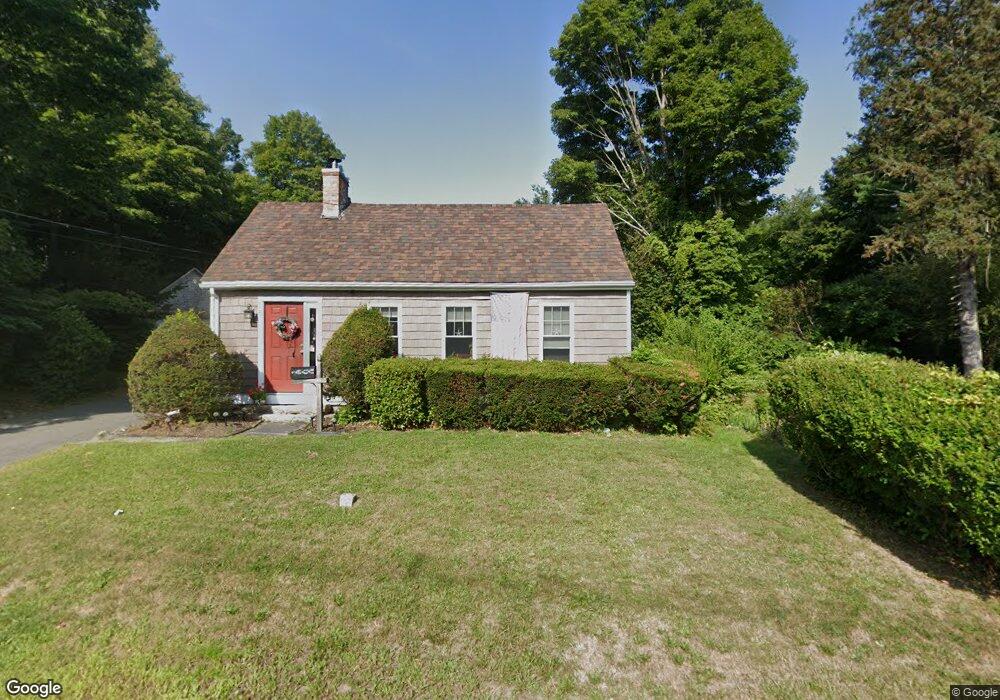
This home is located at 509 E Main St, Avon, MA 02322 and is currently estimated at $574,380, approximately $422 per square foot. 509 E Main St is a home located in Norfolk County with nearby schools including Ralph D. Butler Elementary School and Avon Middle/High School.
Ownership History
Date
Name
Owned For
Owner Type
Purchase Details
Closed on
Nov 17, 2014
Sold by
Hansen Mary L
Bought by
Adams Eric C and Hansen Mary L
Current Estimated Value
Home Financials for this Owner
Home Financials are based on the most recent Mortgage that was taken out on this home.
Original Mortgage
$160,000
Outstanding Balance
$89,823
Interest Rate
4.17%
Mortgage Type
New Conventional
Estimated Equity
$484,557
Create a Home Valuation Report for This Property
The Home Valuation Report is an in-depth analysis detailing your home's value as well as a comparison with similar homes in the area
Home Values in the Area
Average Home Value in this Area
Purchase History
| Date | Buyer | Sale Price | Title Company |
|---|---|---|---|
| Adams Eric C | -- | -- |
Source: Public Records
Mortgage History
| Date | Status | Borrower | Loan Amount |
|---|---|---|---|
| Open | Adams Eric C | $160,000 |
Source: Public Records
Tax History
| Year | Tax Paid | Tax Assessment Tax Assessment Total Assessment is a certain percentage of the fair market value that is determined by local assessors to be the total taxable value of land and additions on the property. | Land | Improvement |
|---|---|---|---|---|
| 2025 | $77 | $580,100 | $201,400 | $378,700 |
| 2024 | $7,275 | $518,500 | $191,200 | $327,300 |
| 2023 | $7,062 | $518,500 | $191,200 | $327,300 |
| 2022 | $7,132 | $451,100 | $159,200 | $291,900 |
| 2021 | $6,818 | $406,300 | $144,600 | $261,700 |
| 2020 | $7,514 | $424,500 | $141,800 | $282,700 |
| 2019 | $6,730 | $374,100 | $141,800 | $232,300 |
| 2018 | $6,940 | $374,100 | $141,800 | $232,300 |
| 2017 | $5,626 | $325,600 | $141,800 | $183,800 |
| 2016 | $5,634 | $329,300 | $141,800 | $187,500 |
| 2015 | $3,587 | $219,100 | $128,900 | $90,200 |
Source: Public Records
Map
Nearby Homes
Your Personal Tour Guide
Ask me questions while you tour the home.