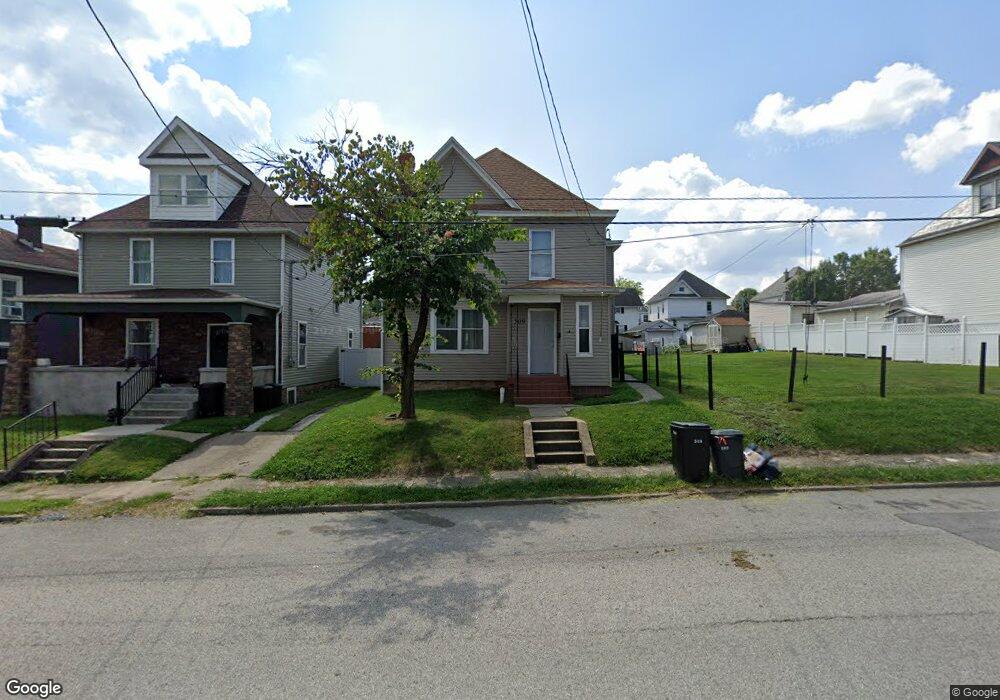
509 E Park Ave Fairmont, WV 26554
Estimated Value: $168,000 - $185,000
3
Beds
2
Baths
1,928
Sq Ft
$91/Sq Ft
Est. Value
About This Home
This home is located at 509 E Park Ave, Fairmont, WV 26554 and is currently estimated at $176,409, approximately $91 per square foot. 509 E Park Ave is a home located in Marion County with nearby schools including East Park Elementary School, East Fairmont High School, and East Fairmont Junior High School.
Ownership History
Date
Name
Owned For
Owner Type
Purchase Details
Closed on
Aug 20, 2019
Sold by
Gidley Nicholas C and Williams Hailey E
Bought by
Hamrick Noah and Hamrick Courtney
Current Estimated Value
Home Financials for this Owner
Home Financials are based on the most recent Mortgage that was taken out on this home.
Original Mortgage
$132,456
Outstanding Balance
$118,103
Interest Rate
4.62%
Mortgage Type
FHA
Estimated Equity
$58,306
Purchase Details
Closed on
Jul 21, 2017
Sold by
Brown Enterprises Llc
Bought by
Gidley Nicholas C and Williams Halley E
Home Financials for this Owner
Home Financials are based on the most recent Mortgage that was taken out on this home.
Original Mortgage
$128,198
Interest Rate
3.89%
Mortgage Type
VA
Purchase Details
Closed on
Oct 12, 2016
Sold by
Mvb Bank Inc
Bought by
Brown Enterprises Llc
Create a Home Valuation Report for This Property
The Home Valuation Report is an in-depth analysis detailing your home's value as well as a comparison with similar homes in the area
Home Values in the Area
Average Home Value in this Area
Purchase History
| Date | Buyer | Sale Price | Title Company |
|---|---|---|---|
| Hamrick Noah | $134,900 | None Available | |
| Gidley Nicholas C | $125,500 | None Available | |
| Brown Enterprises Llc | $29,000 | None Available |
Source: Public Records
Mortgage History
| Date | Status | Borrower | Loan Amount |
|---|---|---|---|
| Open | Hamrick Noah | $132,456 | |
| Previous Owner | Gidley Nicholas C | $128,198 |
Source: Public Records
Tax History Compared to Growth
Tax History
| Year | Tax Paid | Tax Assessment Tax Assessment Total Assessment is a certain percentage of the fair market value that is determined by local assessors to be the total taxable value of land and additions on the property. | Land | Improvement |
|---|---|---|---|---|
| 2024 | $1,269 | $82,140 | $13,500 | $68,640 |
| 2023 | $1,216 | $79,020 | $13,500 | $65,520 |
| 2022 | $1,132 | $76,080 | $13,500 | $62,580 |
| 2021 | $1,073 | $72,900 | $13,500 | $59,400 |
| 2020 | $1,007 | $68,100 | $13,500 | $54,600 |
| 2019 | $981 | $65,400 | $13,920 | $51,480 |
| 2018 | $1,800 | $60,360 | $13,920 | $46,440 |
| 2017 | $1,708 | $57,780 | $12,120 | $45,660 |
| 2016 | $839 | $56,940 | $12,960 | $43,980 |
| 2015 | $826 | $54,960 | $16,380 | $38,580 |
| 2014 | $826 | $55,560 | $17,520 | $38,040 |
Source: Public Records
Map
Nearby Homes
- 511 E Park Ave
- 505 E Park Ave
- 508 E Park Ave
- 512 E Park Ave
- 515 E Park Ave
- 503 E Park Ave
- 506 E Park Ave
- 508 Maryland Ave
- 506 Maryland Ave
- 504 Maryland Ave
- 516 E Park Ave
- 501 E Park Ave
- 512 Maryland Ave
- 502 Maryland Ave
- 102 Dearborn St
- 514 Maryland Ave
- 431 E Park Ave
- 429 E Park Ave
- 540 E Park Ave
- 518 1/2 Maryland Ave