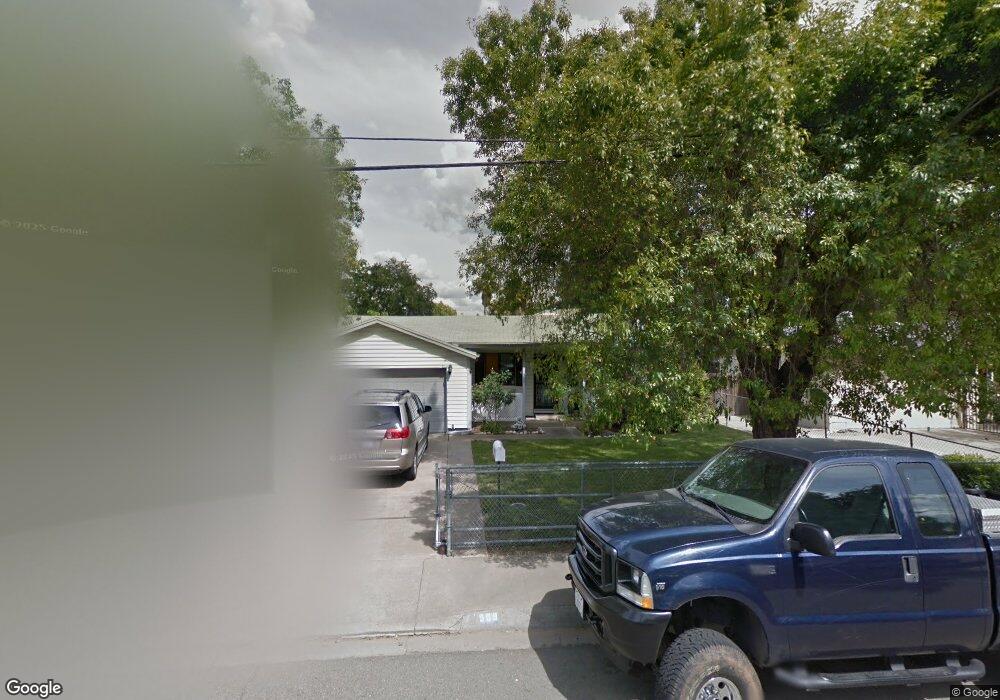
509 E St Roseville, CA 95678
Theiles Manor NeighborhoodEstimated Value: $389,000 - $453,000
3
Beds
1
Bath
1,160
Sq Ft
$364/Sq Ft
Est. Value
About This Home
This home is located at 509 E St, Roseville, CA 95678 and is currently estimated at $422,288, approximately $364 per square foot. 509 E St is a home located in Placer County with nearby schools including George Cirby Elementary School, Warren T. Eich Middle School, and Oakmont High School.
Ownership History
Date
Name
Owned For
Owner Type
Purchase Details
Closed on
Jun 23, 2009
Sold by
Arellanes Priscilla A
Bought by
Arellanes Priscilla A and Arellanes Anthony J
Current Estimated Value
Purchase Details
Closed on
Aug 17, 2006
Sold by
Arellanes Priscilla A
Bought by
Arellanes Priscilla A
Home Financials for this Owner
Home Financials are based on the most recent Mortgage that was taken out on this home.
Original Mortgage
$100,000
Interest Rate
6.7%
Mortgage Type
New Conventional
Create a Home Valuation Report for This Property
The Home Valuation Report is an in-depth analysis detailing your home's value as well as a comparison with similar homes in the area
Home Values in the Area
Average Home Value in this Area
Purchase History
| Date | Buyer | Sale Price | Title Company |
|---|---|---|---|
| Arellanes Priscilla A | -- | None Available | |
| Arellanes Priscilla A | -- | Fidelity National Title Co |
Source: Public Records
Mortgage History
| Date | Status | Borrower | Loan Amount |
|---|---|---|---|
| Previous Owner | Arellanes Priscilla A | $100,000 |
Source: Public Records
Tax History
| Year | Tax Paid | Tax Assessment Tax Assessment Total Assessment is a certain percentage of the fair market value that is determined by local assessors to be the total taxable value of land and additions on the property. | Land | Improvement |
|---|---|---|---|---|
| 2025 | $560 | $58,863 | $12,242 | $46,621 |
| 2023 | $560 | $54,000 | $11,200 | $42,800 |
| 2022 | $4,207 | $400,000 | $80,000 | $320,000 |
| 2021 | $534 | $54,383 | $11,311 | $43,072 |
| 2020 | $530 | $53,827 | $11,196 | $42,631 |
| 2019 | $522 | $52,773 | $10,977 | $41,796 |
| 2018 | $501 | $51,739 | $10,762 | $40,977 |
| 2017 | $493 | $50,725 | $10,551 | $40,174 |
| 2016 | $495 | $49,732 | $10,345 | $39,387 |
| 2015 | $484 | $48,986 | $10,190 | $38,796 |
| 2014 | $475 | $48,028 | $9,991 | $38,037 |
Source: Public Records
Map
Nearby Homes
- 502 Dudley Dr
- 232 La Rue Aly
- 210 C St
- 2152 Milan Way
- 2000 Inglis Way Unit A
- 1342 Church St
- 2054 Ajay Dr
- 0 Bonita St
- 123 Valley Oak Dr Unit 34
- 115 Valley Oak Dr
- 231 Live Oak Cir Unit 2
- 629 Oak St
- 125 Willow Ave
- 930 Circuit Dr
- 707 Jo Anne Ln
- 1309 Hickory St
- 215 Ardmore Ave
- 984 Portside Cir
- 431 Vernon St
- 711 Oak St
Your Personal Tour Guide
Ask me questions while you tour the home.