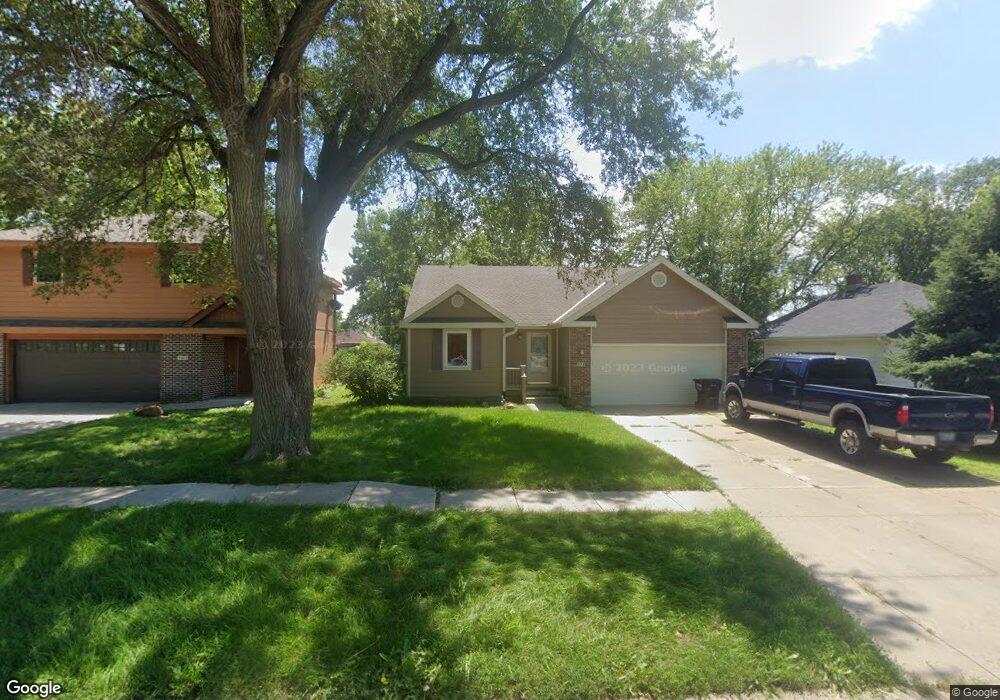
509 Langdon Ave Gretna, NE 68028
Estimated Value: $291,000 - $327,000
3
Beds
2
Baths
1,390
Sq Ft
$223/Sq Ft
Est. Value
About This Home
This home is located at 509 Langdon Ave, Gretna, NE 68028 and is currently estimated at $310,323, approximately $223 per square foot. 509 Langdon Ave is a home located in Sarpy County with nearby schools including Gretna Elementary School, Gretna Middle School, and Gretna High School.
Ownership History
Date
Name
Owned For
Owner Type
Purchase Details
Closed on
May 16, 2018
Sold by
Hardage Sharon and Hardage Jerry
Bought by
Golden Karen A
Current Estimated Value
Purchase Details
Closed on
Jul 26, 2016
Sold by
Hardage Sharon and Hardage Jerry
Bought by
Hardage Sharon and Hardage Jerry
Purchase Details
Closed on
Apr 20, 2016
Sold by
Powers Hardage Sharon
Bought by
Hardage Sharon
Purchase Details
Closed on
May 5, 2008
Sold by
Vandenbroucke John C and Vandenbroucke Linda M
Bought by
Powers Powers Lovie L Lovie L and Ray F Powers & Lovie L Powers Trust 1990
Purchase Details
Closed on
Oct 19, 2007
Sold by
Vandenbroucke John C and Vandenbroucke Linda
Bought by
Interstate Securities Llc
Purchase Details
Closed on
Sep 28, 2006
Sold by
Black Hills Farms Inc
Bought by
Vandenbroucke John C
Create a Home Valuation Report for This Property
The Home Valuation Report is an in-depth analysis detailing your home's value as well as a comparison with similar homes in the area
Home Values in the Area
Average Home Value in this Area
Purchase History
| Date | Buyer | Sale Price | Title Company |
|---|---|---|---|
| Golden Karen A | $200,000 | Nebraska Title Co | |
| Hardage Sharon | -- | None Available | |
| Hardage Sharon | -- | None Available | |
| Powers Powers Lovie L Lovie L | $175,000 | Nlta | |
| Interstate Securities Llc | $159,000 | Clean Title & Escrow Llc | |
| Vandenbroucke John C | $156,000 | Midwest Title |
Source: Public Records
Tax History Compared to Growth
Tax History
| Year | Tax Paid | Tax Assessment Tax Assessment Total Assessment is a certain percentage of the fair market value that is determined by local assessors to be the total taxable value of land and additions on the property. | Land | Improvement |
|---|---|---|---|---|
| 2025 | $5,121 | $331,670 | $36,000 | $295,670 |
| 2024 | $3,991 | $287,405 | $36,000 | $251,405 |
| 2023 | $3,991 | $271,262 | $36,000 | $235,262 |
| 2022 | $4,361 | $241,720 | $36,000 | $205,720 |
| 2021 | $3,937 | $220,704 | $36,000 | $184,704 |
| 2020 | $4,817 | $214,714 | $24,000 | $190,714 |
| 2019 | $4,305 | $192,147 | $24,000 | $168,147 |
| 2018 | $4,309 | $193,167 | $15,200 | $177,967 |
| 2017 | $4,145 | $185,585 | $15,200 | $170,385 |
| 2016 | $4,028 | $180,814 | $15,200 | $165,614 |
| 2015 | -- | $169,796 | $15,200 | $154,596 |
| 2014 | -- | $166,876 | $15,200 | $151,676 |
| 2012 | -- | $161,532 | $15,200 | $146,332 |
Source: Public Records
Map
Nearby Homes
- 11647 Willow Park Dr
- 20717 Frances St
- 213 Highland Dr
- 20919 Birch St
- 347 Michael Dr
- 20926 Oak St
- 206 E Westplains Rd
- 710 Pawnee Dr
- 11808 S 213th St
- 11303 S 210th Ave
- 21205 Stonehaven Ct
- 21113 Flagstone Cir
- Lot 1 Silver Oaks Estates
- Lot 12 Silver Oaks Estates
- 21714 Hackberry Dr
- LOT 12 Gruenther Ridge
- 21605 Hackberry Dr
- Lot 127 W Gruenther Rd
- Lot 111 W Gruenther Rd
- TBD Lot 64 W Gruenther Rd
- 505 Langdon Ave
- 501 Langdon Ave
- 513 Langdon Ave
- 129 Bryan St
- 508 Grandview Ave
- 504 Grandview Ave
- 516 Grandview Ave
- 500 Grandview Ave
- 123 Bryan St
- 520 Grandview Ave
- 210 Bryan St
- 525 Langdon Ave
- 210 S Bryan St
- 214 Bryan St
- 117 Bryan St
- 120 Bryan St
- 120 S Bryan St
- 524 Langdon Ave
- 128 Bryan St
- 524 Grandview Ave