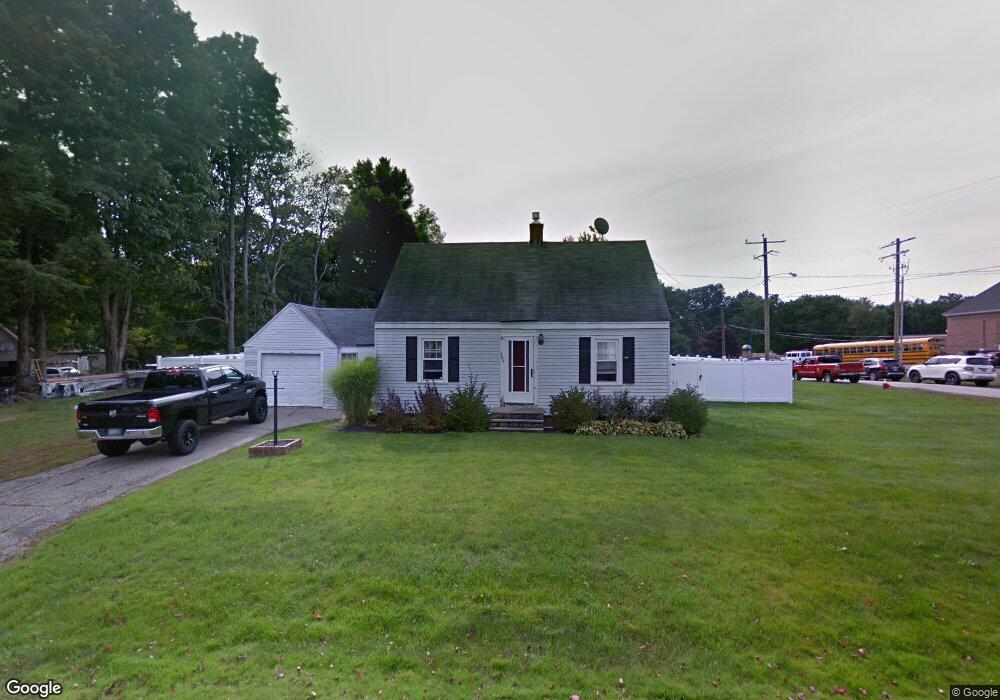
509 Locust St Rollinsford, NH 03869
Estimated Value: $442,000 - $495,000
2
Beds
1
Bath
1,640
Sq Ft
$287/Sq Ft
Est. Value
About This Home
This home is located at 509 Locust St, Rollinsford, NH 03869 and is currently estimated at $471,142, approximately $287 per square foot. 509 Locust St is a home with nearby schools including Rollinsford Grade School, Berwick Academy, and Seacoast Christian School.
Ownership History
Date
Name
Owned For
Owner Type
Purchase Details
Closed on
Oct 1, 2014
Sold by
Halteman Rick
Bought by
Halteman Rick
Current Estimated Value
Home Financials for this Owner
Home Financials are based on the most recent Mortgage that was taken out on this home.
Original Mortgage
$184,000
Outstanding Balance
$141,115
Interest Rate
4.11%
Mortgage Type
New Conventional
Estimated Equity
$330,027
Purchase Details
Closed on
Aug 1, 2002
Sold by
Brown Ronald E
Bought by
Halteman Ricky L and Halteman Jennifer L
Home Financials for this Owner
Home Financials are based on the most recent Mortgage that was taken out on this home.
Original Mortgage
$154,000
Interest Rate
6.64%
Create a Home Valuation Report for This Property
The Home Valuation Report is an in-depth analysis detailing your home's value as well as a comparison with similar homes in the area
Home Values in the Area
Average Home Value in this Area
Purchase History
| Date | Buyer | Sale Price | Title Company |
|---|---|---|---|
| Halteman Rick | -- | -- | |
| Halteman Ricky L | $192,500 | -- |
Source: Public Records
Mortgage History
| Date | Status | Borrower | Loan Amount |
|---|---|---|---|
| Open | Halteman Rick | $184,000 | |
| Previous Owner | Halteman Ricky L | $136,700 | |
| Previous Owner | Halteman Ricky L | $154,000 |
Source: Public Records
Tax History Compared to Growth
Tax History
| Year | Tax Paid | Tax Assessment Tax Assessment Total Assessment is a certain percentage of the fair market value that is determined by local assessors to be the total taxable value of land and additions on the property. | Land | Improvement |
|---|---|---|---|---|
| 2024 | $6,613 | $403,000 | $231,500 | $171,500 |
| 2023 | $6,198 | $403,000 | $231,500 | $171,500 |
| 2022 | $5,993 | $403,000 | $231,500 | $171,500 |
| 2021 | $5,849 | $239,900 | $123,200 | $116,700 |
| 2020 | $5,921 | $239,900 | $123,200 | $116,700 |
| 2019 | $54 | $239,900 | $123,200 | $116,700 |
| 2018 | $53 | $239,900 | $123,200 | $116,700 |
| 2016 | $5,588 | $199,700 | $86,600 | $113,100 |
| 2015 | $5,478 | $199,700 | $86,600 | $113,100 |
| 2014 | $5,292 | $199,700 | $86,600 | $113,100 |
| 2013 | $5,368 | $199,700 | $86,600 | $113,100 |
Source: Public Records
Map
Nearby Homes