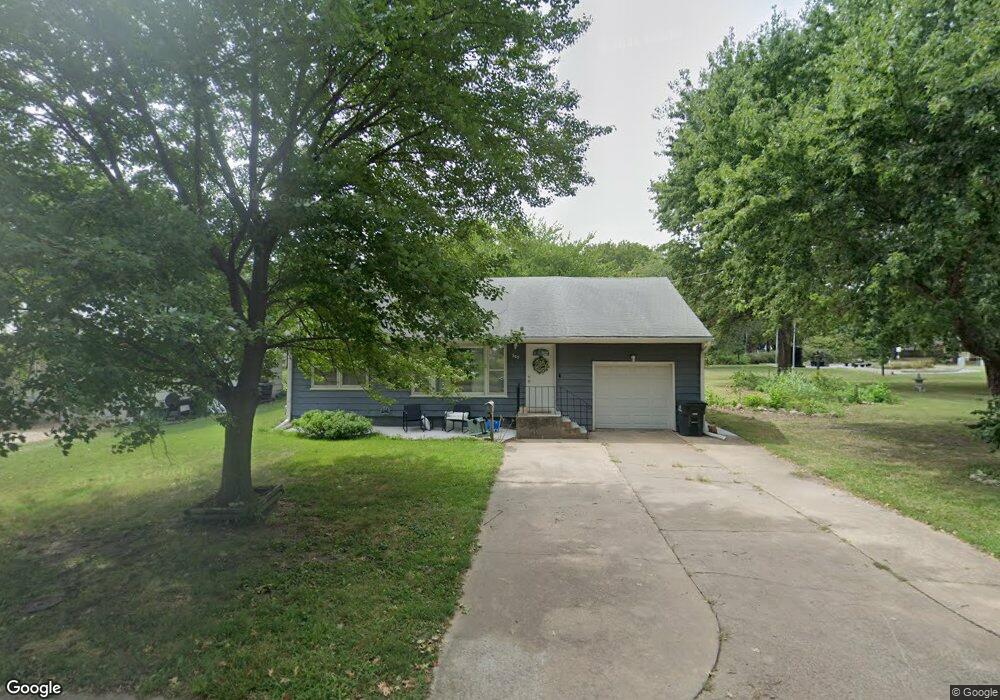
509 Locust St Wamego, KS 66547
Estimated Value: $119,000 - $171,000
2
Beds
1
Bath
1,912
Sq Ft
$74/Sq Ft
Est. Value
About This Home
This home is located at 509 Locust St, Wamego, KS 66547 and is currently estimated at $140,772, approximately $73 per square foot. 509 Locust St is a home located in Pottawatomie County with nearby schools including Central Elementary School, West Elementary School, and Wamego Middle School.
Ownership History
Date
Name
Owned For
Owner Type
Purchase Details
Closed on
Mar 20, 2023
Sold by
Maransani Casey Joe and Maransani Megan
Bought by
Sani Investments Llc
Current Estimated Value
Purchase Details
Closed on
Jan 14, 2021
Sold by
Italian Dev Grp Llc
Bought by
Maransani Casey J and Maransani Megan
Home Financials for this Owner
Home Financials are based on the most recent Mortgage that was taken out on this home.
Original Mortgage
$108,750
Interest Rate
2.71%
Mortgage Type
Purchase Money Mortgage
Purchase Details
Closed on
Jul 13, 2020
Sold by
Dixon Steven M
Bought by
Italian Dev Grp Inc
Home Financials for this Owner
Home Financials are based on the most recent Mortgage that was taken out on this home.
Original Mortgage
$96,400
Interest Rate
3.1%
Mortgage Type
New Conventional
Purchase Details
Closed on
May 10, 2010
Sold by
Johnson Patti M and Johnson Richard
Bought by
Dixon Steven M
Home Financials for this Owner
Home Financials are based on the most recent Mortgage that was taken out on this home.
Original Mortgage
$4,000
Interest Rate
5.02%
Create a Home Valuation Report for This Property
The Home Valuation Report is an in-depth analysis detailing your home's value as well as a comparison with similar homes in the area
Home Values in the Area
Average Home Value in this Area
Purchase History
| Date | Buyer | Sale Price | Title Company |
|---|---|---|---|
| Sani Investments Llc | -- | -- | |
| Maransani Casey J | -- | None Available | |
| Italian Dev Grp Inc | -- | None Available | |
| Dixon Steven M | -- | None Available |
Source: Public Records
Mortgage History
| Date | Status | Borrower | Loan Amount |
|---|---|---|---|
| Previous Owner | Maransani Casey J | $108,750 | |
| Previous Owner | Italian Dev Grp Inc | $96,400 | |
| Previous Owner | Dixon Steven M | $4,000 | |
| Previous Owner | Dixon Steven M | $80,125 |
Source: Public Records
Tax History Compared to Growth
Tax History
| Year | Tax Paid | Tax Assessment Tax Assessment Total Assessment is a certain percentage of the fair market value that is determined by local assessors to be the total taxable value of land and additions on the property. | Land | Improvement |
|---|---|---|---|---|
| 2025 | $1,244 | $11,730 | $1,395 | $10,335 |
| 2024 | $12 | $11,082 | $1,209 | $9,873 |
| 2023 | $1,323 | $10,953 | $1,170 | $9,783 |
| 2022 | $1,253 | $9,607 | $1,182 | $8,425 |
| 2021 | $1,253 | $10,354 | $1,182 | $9,172 |
| 2020 | $1,253 | $10,293 | $1,234 | $9,059 |
| 2019 | $1,254 | $10,270 | $1,234 | $9,036 |
| 2018 | $1,214 | $9,982 | $1,320 | $8,662 |
| 2017 | $1,183 | $9,729 | $1,320 | $8,409 |
| 2016 | $1,233 | $10,252 | $1,273 | $8,979 |
| 2015 | -- | $10,028 | $1,273 | $8,755 |
| 2014 | -- | $9,913 | $1,179 | $8,734 |
Source: Public Records
Map
Nearby Homes