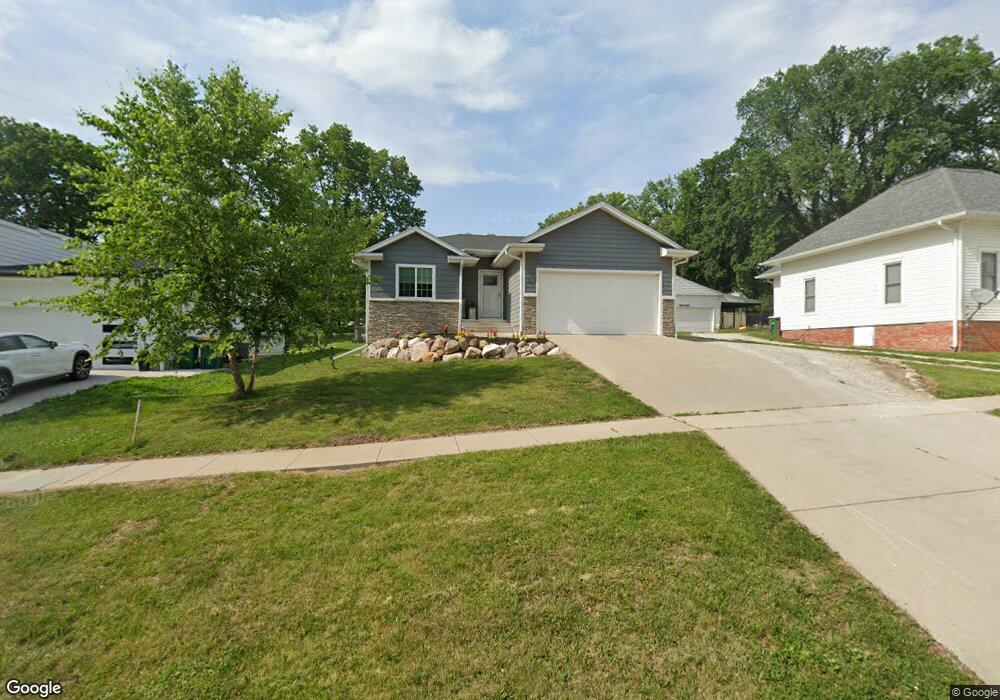
509 Maple St de Soto, IA 50069
Estimated Value: $231,000 - $292,000
2
Beds
3
Baths
1,300
Sq Ft
$206/Sq Ft
Est. Value
About This Home
This home is located at 509 Maple St, de Soto, IA 50069 and is currently estimated at $268,012, approximately $206 per square foot. 509 Maple St is a home located in Dallas County with nearby schools including Adel Elementary School, DeSoto Intermediate School, and ADM Middle School.
Ownership History
Date
Name
Owned For
Owner Type
Purchase Details
Closed on
Oct 18, 2018
Sold by
Jordan Framing Llc
Bought by
Christianson Angela N and Christianson Carter J
Current Estimated Value
Home Financials for this Owner
Home Financials are based on the most recent Mortgage that was taken out on this home.
Original Mortgage
$124,745
Outstanding Balance
$108,785
Interest Rate
4.5%
Mortgage Type
FHA
Estimated Equity
$159,227
Purchase Details
Closed on
Aug 10, 2015
Sold by
Christianson Carter J and Christianson Angela N
Bought by
Framing Jordan
Purchase Details
Closed on
Feb 24, 2014
Sold by
Peeler Sherri L
Bought by
Christianson Carter J and Christianson Angela N
Create a Home Valuation Report for This Property
The Home Valuation Report is an in-depth analysis detailing your home's value as well as a comparison with similar homes in the area
Home Values in the Area
Average Home Value in this Area
Purchase History
| Date | Buyer | Sale Price | Title Company |
|---|---|---|---|
| Christianson Angela N | $137,000 | None Available | |
| Framing Jordan | -- | None Available | |
| Christianson Carter J | $11,000 | None Available |
Source: Public Records
Mortgage History
| Date | Status | Borrower | Loan Amount |
|---|---|---|---|
| Open | Christianson Angela N | $124,745 |
Source: Public Records
Tax History Compared to Growth
Tax History
| Year | Tax Paid | Tax Assessment Tax Assessment Total Assessment is a certain percentage of the fair market value that is determined by local assessors to be the total taxable value of land and additions on the property. | Land | Improvement |
|---|---|---|---|---|
| 2024 | $3,998 | $239,380 | $21,840 | $217,540 |
| 2023 | $3,998 | $239,380 | $21,840 | $217,540 |
| 2022 | $3,778 | $205,170 | $21,840 | $183,330 |
| 2021 | $3,778 | $199,090 | $21,840 | $177,250 |
| 2020 | $3,806 | $190,250 | $21,840 | $168,410 |
| 2019 | $4,020 | $190,250 | $21,840 | $168,410 |
| 2018 | $4,020 | $191,840 | $21,840 | $170,000 |
| 2017 | $3,846 | $191,620 | $12,480 | $179,140 |
| 2016 | $76 | $186,140 | $12,480 | $173,660 |
| 2015 | $74 | $3,670 | $0 | $0 |
| 2014 | $70 | $3,670 | $0 | $0 |
Source: Public Records
Map
Nearby Homes