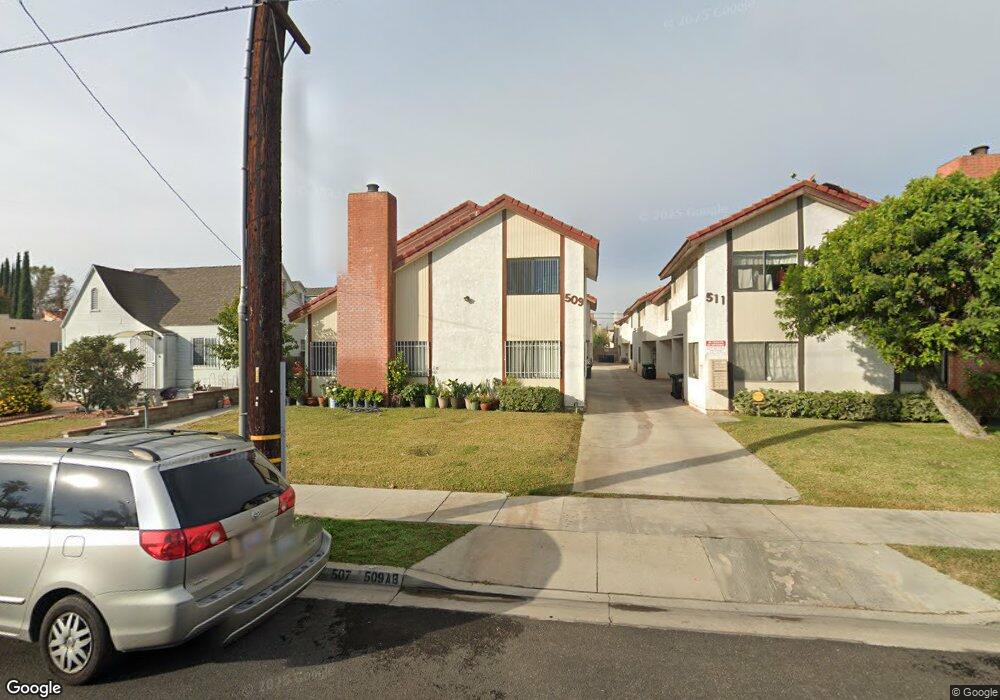
509 N Mcpherrin Ave Unit A Monterey Park, CA 91754
Estimated Value: $757,000 - $861,000
3
Beds
3
Baths
1,561
Sq Ft
$511/Sq Ft
Est. Value
About This Home
This home is located at 509 N Mcpherrin Ave Unit A, Monterey Park, CA 91754 and is currently estimated at $797,220, approximately $510 per square foot. 509 N Mcpherrin Ave Unit A is a home located in Los Angeles County with nearby schools including Ynez Elementary School, Mark Keppel High School, and St. Stephen Martyr School.
Ownership History
Date
Name
Owned For
Owner Type
Purchase Details
Closed on
May 31, 2013
Sold by
Chua Lisa Chau
Bought by
See Richard Johnson and Chua Family Irrevocable Trust
Current Estimated Value
Purchase Details
Closed on
Feb 13, 2013
Sold by
See Richard Johnson
Bought by
Chua Lisa Chau
Purchase Details
Closed on
May 21, 2012
Sold by
Chua Lisa Chau
Bought by
See Richard Johnson and Chua Family Irrevocable Trust
Purchase Details
Closed on
Jan 11, 2008
Sold by
Huynh Huong
Bought by
Chua Lisa Chau
Purchase Details
Closed on
Jun 20, 2002
Sold by
Santos Ricky Y
Bought by
Huynh Huong
Purchase Details
Closed on
Dec 12, 1996
Sold by
Wong Gordon M
Bought by
Santos Ricky Y
Home Financials for this Owner
Home Financials are based on the most recent Mortgage that was taken out on this home.
Original Mortgage
$117,600
Interest Rate
7.76%
Create a Home Valuation Report for This Property
The Home Valuation Report is an in-depth analysis detailing your home's value as well as a comparison with similar homes in the area
Home Values in the Area
Average Home Value in this Area
Purchase History
| Date | Buyer | Sale Price | Title Company |
|---|---|---|---|
| See Richard Johnson | -- | Accommodation | |
| Chua Lisa Chau | -- | None Available | |
| See Richard Johnson | -- | None Available | |
| Chua Lisa Chau | -- | None Available | |
| Huynh Huong | -- | -- | |
| Huynh Huong | -- | -- | |
| Santos Ricky Y | $147,000 | South Coast Title |
Source: Public Records
Mortgage History
| Date | Status | Borrower | Loan Amount |
|---|---|---|---|
| Previous Owner | Santos Ricky Y | $117,600 |
Source: Public Records
Tax History Compared to Growth
Tax History
| Year | Tax Paid | Tax Assessment Tax Assessment Total Assessment is a certain percentage of the fair market value that is determined by local assessors to be the total taxable value of land and additions on the property. | Land | Improvement |
|---|---|---|---|---|
| 2025 | $6,380 | $491,237 | $302,101 | $189,136 |
| 2024 | $6,380 | $481,606 | $296,178 | $185,428 |
| 2023 | $6,250 | $472,164 | $290,371 | $181,793 |
| 2022 | $5,953 | $462,907 | $284,678 | $178,229 |
| 2021 | $5,878 | $453,832 | $279,097 | $174,735 |
| 2019 | $5,667 | $440,373 | $270,820 | $169,553 |
| 2018 | $5,671 | $431,739 | $265,510 | $166,229 |
| 2016 | $5,239 | $414,975 | $255,200 | $159,775 |
| 2015 | $5,157 | $408,743 | $251,367 | $157,376 |
| 2014 | $5,085 | $400,738 | $246,444 | $154,294 |
Source: Public Records
Map
Nearby Homes
- 516 N Moore Ave Unit A
- 500 N Moore Ave Unit E
- 513 W Emerson Ave Unit C
- 2037 S 3rd St
- 215 W Garcelon Ave
- 305 N Baltimore Ave Unit C
- 419 N Chandler Ave Unit 508
- 419 N Chandler Ave Unit 311
- 419 N Chandler Ave Unit 308
- 419 N Chandler Ave Unit 413
- 419 N Chandler Ave Unit 305
- 419 N Chandler Ave Unit 319
- 612 W Ramona Rd
- 600 N Atlantic Blvd Unit 516
- 600 N Atlantic Blvd Unit 508
- 600 N Atlantic Blvd Unit 207
- 0 N Atlantic Blvd Unit WS23107010
- 406 N Lincoln Ave Unit A
- 215 N Lincoln Ave
- 125 S Moore Ave Unit 2
- 509 N Mcpherrin Ave Unit B
- 515 N Mcpherrin Ave Unit B
- 515 N Mcpherrin Ave Unit A
- 511 N Mcpherrin Ave Unit B
- 511 N Mcpherrin Ave Unit A
- 507 N Mcpherrin Ave Unit C
- 517 N Mcpherrin Ave Unit B
- 517 N Mcpherrin Ave Unit C
- 505 N Mcpherrin Ave
- 411 Hilliard Ave
- 519 N Mcpherrin Ave
- 415 Hilliard Ave
- 501 N Mcpherrin Ave
- 417 Hilliard Ave
- 523 N Mcpherrin Ave
- 410 Hampton Ave
- 510 N Ynez Ave
- 414 Hampton Ave
- 514 N Ynez Ave
- 514 N Ynez Ave