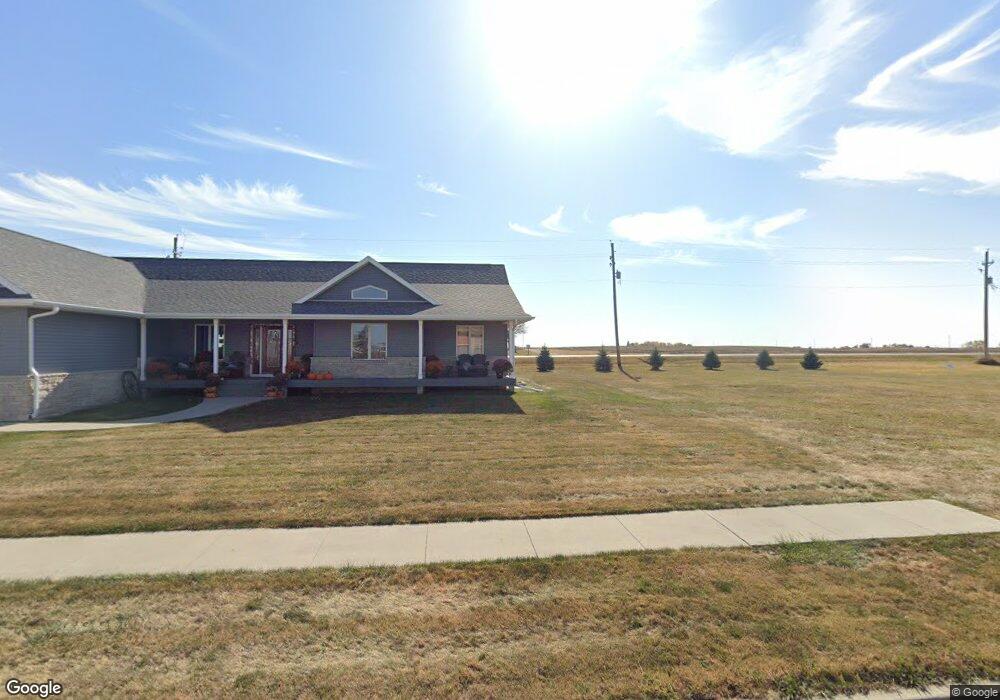
509 NE Maple St Elkhart, IA 50073
Estimated Value: $291,000 - $329,000
2
Beds
2
Baths
1,093
Sq Ft
$281/Sq Ft
Est. Value
About This Home
This home is located at 509 NE Maple St, Elkhart, IA 50073 and is currently estimated at $306,966, approximately $280 per square foot. 509 NE Maple St is a home located in Polk County with nearby schools including North Polk Central Elementary School, North Polk West Elementary School, and North Polk Middle School.
Ownership History
Date
Name
Owned For
Owner Type
Purchase Details
Closed on
Dec 7, 2021
Sold by
Bagby Nathaniel Henry and Estate Of Dwight Otis Bagby
Bought by
Seemann Timothy David and Seemann Kimberly Ann
Current Estimated Value
Home Financials for this Owner
Home Financials are based on the most recent Mortgage that was taken out on this home.
Original Mortgage
$212,000
Outstanding Balance
$194,583
Interest Rate
3.11%
Mortgage Type
New Conventional
Estimated Equity
$112,383
Purchase Details
Closed on
Jan 14, 2008
Sold by
Terrell Robert W and Terrell Deborah A
Bought by
Bagby Dwight O
Home Financials for this Owner
Home Financials are based on the most recent Mortgage that was taken out on this home.
Original Mortgage
$169,900
Interest Rate
6.37%
Mortgage Type
Purchase Money Mortgage
Create a Home Valuation Report for This Property
The Home Valuation Report is an in-depth analysis detailing your home's value as well as a comparison with similar homes in the area
Home Values in the Area
Average Home Value in this Area
Purchase History
| Date | Buyer | Sale Price | Title Company |
|---|---|---|---|
| Seemann Timothy David | $270,000 | None Available | |
| Bagby Dwight O | $169,500 | Itc | |
| Terrell Robert W | $30,000 | Itc |
Source: Public Records
Mortgage History
| Date | Status | Borrower | Loan Amount |
|---|---|---|---|
| Open | Seemann Timothy David | $212,000 | |
| Previous Owner | Bagby Dwight O | $169,900 |
Source: Public Records
Tax History Compared to Growth
Tax History
| Year | Tax Paid | Tax Assessment Tax Assessment Total Assessment is a certain percentage of the fair market value that is determined by local assessors to be the total taxable value of land and additions on the property. | Land | Improvement |
|---|---|---|---|---|
| 2025 | $4,604 | $289,900 | $65,200 | $224,700 |
| 2024 | $4,604 | $255,200 | $56,900 | $198,300 |
| 2023 | $4,654 | $255,200 | $56,900 | $198,300 |
| 2022 | $4,554 | $217,700 | $48,100 | $169,600 |
| 2021 | $4,152 | $217,700 | $48,100 | $169,600 |
| 2020 | $4,032 | $193,900 | $42,800 | $151,100 |
| 2019 | $3,698 | $193,900 | $42,800 | $151,100 |
| 2018 | $3,650 | $170,400 | $37,000 | $133,400 |
| 2017 | $3,714 | $170,400 | $37,000 | $133,400 |
| 2016 | $3,486 | $168,100 | $35,800 | $132,300 |
| 2015 | $3,486 | $168,100 | $35,800 | $132,300 |
| 2014 | $3,390 | $157,200 | $33,500 | $123,700 |
Source: Public Records
Map
Nearby Homes
- 418 NE Maple St
- 213 NE Megan Ave
- 411 N Allison Ave
- 310 NE Adams Ave
- 503 NE Allison Ave
- 802 NE Elm St
- 112 NE Allison Ave
- 409 NE Adams Ave
- 321 NE Chalet St
- 319 NE Chalet St
- 317 NE Chalet St
- 166 NW Maple St
- 411 NE Madison Ave
- 501 NE Madison Ave
- Hoover C Plan at Kimberly Woods
- Harrison Plan at Kimberly Woods
- Eisenhower Plan at Kimberly Woods
- Hoover B Plan at Kimberly Woods
- Reagan Plan at Kimberly Woods
- Hoover Plan at Kimberly Woods
- 505 NE Maple St
- 505 NE Maple St
- 513 NE Maple St
- 517 NE Maple St
- 105 NE Megan Ave
- 106 NE Cedar Ln
- 417 NE Maple St
- 109 N East Megan Ave
- 109 NE Megan Ave
- 418 NE Maple St
- 524 E Maple St
- 110 NE Cedar Ln
- 413 NE Maple St
- 601 NE Maple St
- 108 N East Megan Ave
- 108 NE Megan Ave
- 113 N East Megan Ave
- 409 NE Maple St
- 114 NE Cedar Ln
- 520 E Maple St