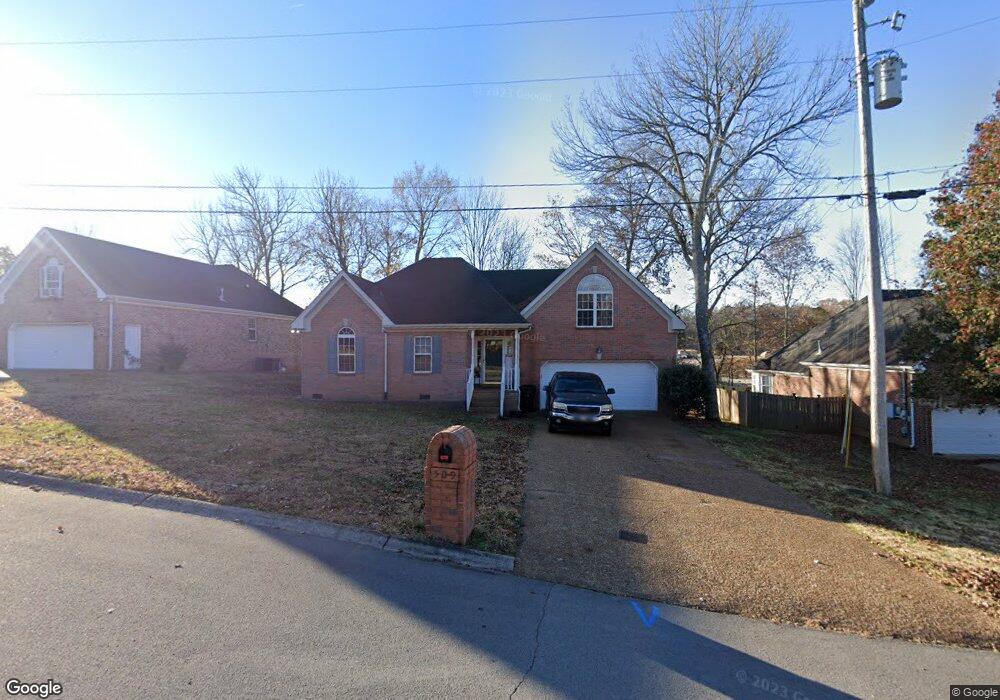
509 Parrish Way Mount Juliet, TN 37122
Estimated Value: $407,786 - $464,000
--
Bed
2
Baths
1,894
Sq Ft
$230/Sq Ft
Est. Value
About This Home
This home is located at 509 Parrish Way, Mount Juliet, TN 37122 and is currently estimated at $436,197, approximately $230 per square foot. 509 Parrish Way is a home located in Wilson County with nearby schools including Stoner Creek Elementary School, West Wilson Middle School, and Mt. Juliet High School.
Ownership History
Date
Name
Owned For
Owner Type
Purchase Details
Closed on
Oct 30, 2017
Sold by
Rowlett Irene H
Bought by
Thorn Andrew Gifford
Current Estimated Value
Purchase Details
Closed on
Nov 13, 2009
Sold by
Rowlett Charles B
Bought by
Rowlett Irene H
Purchase Details
Closed on
Oct 17, 2003
Sold by
Rowlett Shelley N
Bought by
Robinson Dean Trustee
Home Financials for this Owner
Home Financials are based on the most recent Mortgage that was taken out on this home.
Original Mortgage
$104,250
Interest Rate
6.16%
Purchase Details
Closed on
Oct 2, 2003
Bought by
Rowlett Shelley N
Home Financials for this Owner
Home Financials are based on the most recent Mortgage that was taken out on this home.
Original Mortgage
$104,250
Interest Rate
6.16%
Purchase Details
Closed on
Mar 29, 2000
Sold by
Universal Builders
Bought by
Hutchins Barbie P and Hutchins Kurt D
Purchase Details
Closed on
Jun 3, 1999
Bought by
Universal Builders
Create a Home Valuation Report for This Property
The Home Valuation Report is an in-depth analysis detailing your home's value as well as a comparison with similar homes in the area
Home Values in the Area
Average Home Value in this Area
Purchase History
| Date | Buyer | Sale Price | Title Company |
|---|---|---|---|
| Thorn Andrew Gifford | $179,900 | None Available | |
| Rowlett Irene H | $167,610 | -- | |
| Robinson Dean Trustee | -- | -- | |
| Rowlett Shelley N | $130,400 | -- | |
| Hutchins Barbie P | $140,050 | -- | |
| Universal Builders | $456,000 | -- |
Source: Public Records
Mortgage History
| Date | Status | Borrower | Loan Amount |
|---|---|---|---|
| Previous Owner | Universal Builders | $104,250 |
Source: Public Records
Tax History Compared to Growth
Tax History
| Year | Tax Paid | Tax Assessment Tax Assessment Total Assessment is a certain percentage of the fair market value that is determined by local assessors to be the total taxable value of land and additions on the property. | Land | Improvement |
|---|---|---|---|---|
| 2024 | $1,384 | $72,500 | $18,750 | $53,750 |
| 2022 | $1,384 | $72,500 | $18,750 | $53,750 |
| 2021 | $1,464 | $72,500 | $18,750 | $53,750 |
| 2020 | $1,481 | $72,500 | $18,750 | $53,750 |
| 2019 | $184 | $55,150 | $16,250 | $38,900 |
| 2018 | $1,481 | $55,150 | $16,250 | $38,900 |
| 2017 | $1,481 | $55,150 | $16,250 | $38,900 |
| 2016 | $1,481 | $55,150 | $16,250 | $38,900 |
| 2015 | $1,528 | $55,150 | $16,250 | $38,900 |
| 2014 | $1,295 | $46,736 | $0 | $0 |
Source: Public Records
Map
Nearby Homes
- 3 Silva Loop
- 842 Silva Loop
- 2 Silva Loop
- 834 Silva Loop
- 830 Silva Loop
- 828 Silva Loop
- 1 Silva Loop
- 826 Silva Loop
- 464 Tomlinson Pointe Dr
- 467 Tomlinson Pointe Dr
- McCourt Plan at Tomlinson Pointe - Longford Collection
- Higgins Plan at Tomlinson Pointe - Carlow Collection
- Wicklow Plan at Tomlinson Pointe - Longford Collection
- Bowen Plan at Tomlinson Pointe - Carlow Collection
- Kildare Plan at Tomlinson Pointe - Longford Collection
- Donegal Plan at Tomlinson Pointe - Carlow Collection
- 307 Parrish Crescent
- 463 Tomlinson Pointe Dr
- 460 Tomlinson Pointe Dr
- 3289 Tomlinson Pointe Dr
- 507 Parrish Way
- 511 Parrish Way
- 505 Parrish Way
- 513 Parrish Way
- 506 Parrish Way
- 508 Parrish Way
- 504 Parrish Way
- 512 Parrish Way
- 503 Parrish Way
- 510 Parrish Way
- 502 Parrish Way
- 2980 Curd Rd
- 2978 Curd Rd
- 207 Parrish Place
- 209 Parrish Place
- 2982 Curd Rd
- 501 Parrish Way
- 500 Parrish Way
- 205 Parrish Place
- 211 Parrish Place